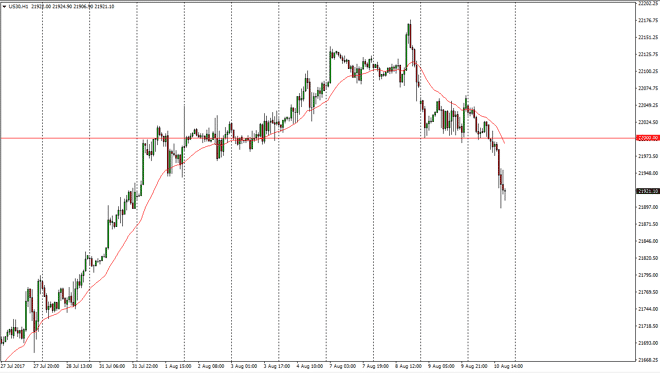
Dow Jones 30 The Dow Jones 30 broke down during the day on Thursday, slicing below the 22,000 level. By doing so, it shows a massive amount of bearish
The Dow Jones 30 broke down during the day on Thursday, slicing below the 22,000 level. By doing so, it shows a massive amount of bearish pressure, but I do believe that there are enough buyers in the market that we will eventually see a snapback. If we can break above the 22,000 level, that should be a very bullish sign. Alternately, if we break down below the 21,900 level on a daily close, then I think the market will continue to go lower.
The NASDAQ 100 fell significantly as well, but the 5800-level underneath offers significant support from a psychological standpoint, and if we can break down below there it should continue to go much lower. If we break above the top of the hammer on the hourly chart, I think that we could reach towards the 5900 level above. This is a market that will continue to be volatile, but if the US stock indices are going to rally and show signs of life, it’s probably going to be in the NASDAQ 101st as it has been the leader overall. Expect volatility, but quite frankly these pullbacks will probably be looked at as buying opportunities for value hunters that are more long-term minded as the markets have shown almost no volatility over the last several weeks.
Chris is a proprietary trader with more than 20 years of experience across various markets, including currencies, indices and commodities. As a senior analyst at FXEmpire since the website’s early days, he offers readers advanced market perspectives to navigate today’s financial landscape with confidence.