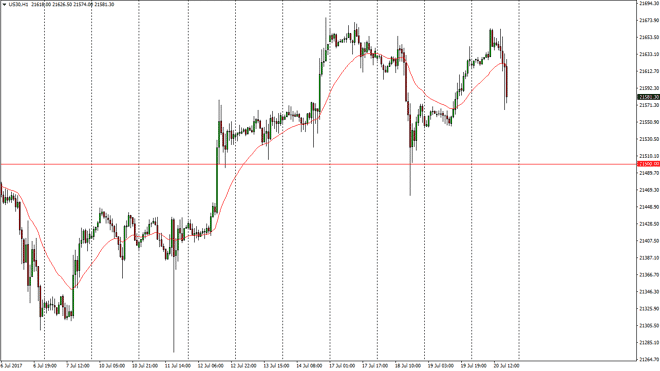
Dow Jones 30 The Dow Jones 30 fell after initially tried to rally during the Thursday session, mainly due to an announcement that they were expanding the
The Dow Jones 30 fell after initially tried to rally during the Thursday session, mainly due to an announcement that they were expanding the investigation into Donald Trump’s global companies. This isn’t to say that they found anything, just that they are looking in obvious places. Because of this, the market reacted negatively, but quite frankly nothing is there yet, and I believe that value hunters are going to come back into the market as they have every other time this is happened. The 21,500-level underneath should be the “floor” in the market, and I believe that buyers are going to come back into this market and reach towards the upside.
The NASDAQ 100 fell as well, but found enough support just below the 5900 level to bounce again. This is a market that has been very bullish longer-term, and therefore seems likely to bounce. I think that we will eventually reach towards the 6000 level above, which is a target. I have no interest in shorting this market, least not at this point. I think that there are plenty of buyer’s underneath looking to pick up value, and that these announcements continue to offer an opportunity to take advantage of amateurs in the market who do not think before they act. Longer-term, I not only anticipate that the market will reach the 6000 handle, but there is nothing on the chart to suggest that it won’t be able to break through it, albeit after several attempts more than likely as it is a large, round, psychologically significant number. I have no interest in shorting the market due to the massive uptrend that we have seen, and believe that even if we break down below the 5900 level, there is a significant amount of support to be found at the 5850 level as well.
Chris is a proprietary trader with more than 20 years of experience across various markets, including currencies, indices and commodities. As a senior analyst at FXEmpire since the website’s early days, he offers readers advanced market perspectives to navigate today’s financial landscape with confidence.