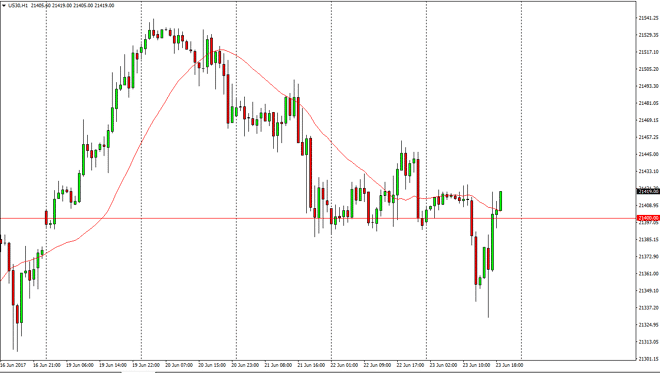
Dow Jones 30 The Dow Jones 30 initially went sideways, but then broke down significantly below the 21,400 level. Ultimately, the market dropped down to
The Dow Jones 30 initially went sideways, but then broke down significantly below the 21,400 level. Ultimately, the market dropped down to the 21,325 handle, only to find buyers again. We bounced enough to form a bit of a hammer during the day, and it looks as if we are going to continue to go higher, perhaps reaching towards the 21,500 level. Ultimately, I believe that the market continues to give opportunity on dips. Choppiness will continue to be the case, but I think today had more to do with the rebalancing of the Russell 2000. I believe that the Dow Jones 30 as well as the rest of the United States indices should continue to be bullish overall.
The NASDAQ 100 did the same thing, going sideways initially, but then turning back around to reach to the upside and break above the 5800 level. A break above the top of the recent of move could send this market much higher, perhaps 5900 and then eventually 6000. I believe the pullbacks continue to be buying opportunities, as tech stocks are starting to come back into favor again. A short-term pullback is simply a buying opportunity, as it offers value. I believe the biotech stocks will continue to push higher, and ultimately that we will go hunting the aforementioned 6000 handle. A break above there is a major victory for the buyers and I think once that happens we will see a flood of new money come into the market. I’ve got no interest in shorting this market, and I believe that the 5750-level underneath continues to be a bit of a “floor” in the market. The NASDAQ 100 has lead the rest of the US-based indices higher over the longer term, and I think that will continue to be the case.
Chris is a proprietary trader with more than 20 years of experience across various markets, including currencies, indices and commodities. As a senior analyst at FXEmpire since the website’s early days, he offers readers advanced market perspectives to navigate today’s financial landscape with confidence.