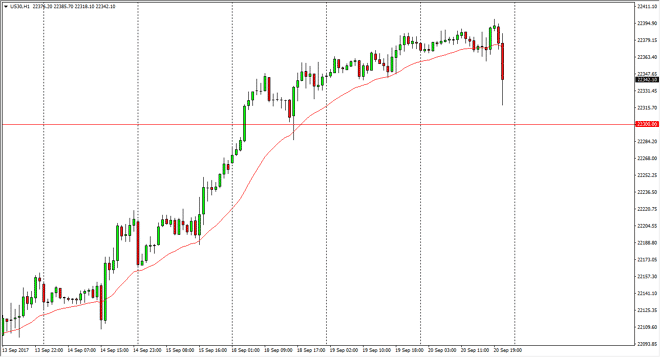
Dow Jones 30 The Dow Jones 30 fell in reaction to the Federal Reserve announcements, and the idea of the markets having to deal with a balance sheet
The Dow Jones 30 fell in reaction to the Federal Reserve announcements, and the idea of the markets having to deal with a balance sheet reduction. However, the Dow Jones 30 held up much better than the other indices that I follow, so therefore think this will continue to be the leader. The 22,300 level continues to offer support, and quite frankly, by the time that the news conference came out with Janet Yellen speaking, the market started to recover already. I think that the buyers are jumping in and looking at this is a potential buying opportunity. I believe that the 22,300 level should offer support, and I think that the Dow Jones 30 continues to lead the US stock indices higher overall.
Unlike the Dow Jones 30, the NASDAQ 100 got absolutely pummeled. However, this has been a weak spot in the US stock markets as of late anyway, so it probably took a lot less convincing to have trader selling this market place off. I do think that the buyers are coming back, and I also believe that the 5900-level underneath will continue to be supportive. Given enough time, we should go looking towards the 6000 level, but I much more comfortable buying the S&P 500 and the Dow Jones 30 that I am the NASDAQ 100 currently. It’s not that I think that the NASDAQ 100 is going to break down significantly, it’s just that I know there is much more momentum in both of the other markets. Because of this, I am bullish but much more likely to put money to work in those other indices. If we break down below 5900, that would be a very negative sign obviously.
Chris is a proprietary trader with more than 20 years of experience across various markets, including currencies, indices and commodities. As a senior analyst at FXEmpire since the website’s early days, he offers readers advanced market perspectives to navigate today’s financial landscape with confidence.