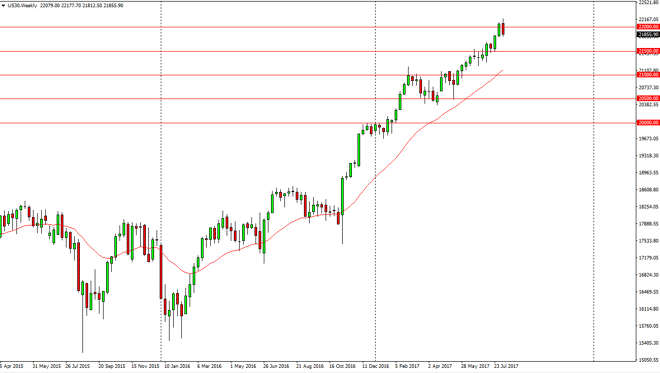
Dow Jones 30 The Dow Jones 30 initially tried to rally during the week but then broke down below the 22,000 level. It looks likely that the market is
The Dow Jones 30 initially tried to rally during the week but then broke down below the 22,000 level. It looks likely that the market is going to go down to the 21,500 level after that. If we break down below the bottom of the candle, then it’s a shorter-term a selling opportunity, but if we can’t, then I think what we’re going to see is consolidation around the 22,000 level. This is a market that’s been in an uptrend for some time, so more than likely we will eventually attract value investors at lower levels.
The NASDAQ 100 has rallied significantly after falling rather hard during the week. The 5700 level below seems to scare investors from selling too much, and it looks like the buyers are trying to come back. The market should then go climbing towards the 5900 level, and then perhaps to the 6000 level after that. I don’t have any interest in selling, I believe it’s only a matter of time before the buyers return and that there is a significant “floor” somewhere near the 5500 level underneath.
Chris is a proprietary trader with more than 20 years of experience across various markets, including currencies, indices and commodities. As a senior analyst at FXEmpire since the website’s early days, he offers readers advanced market perspectives to navigate today’s financial landscape with confidence.