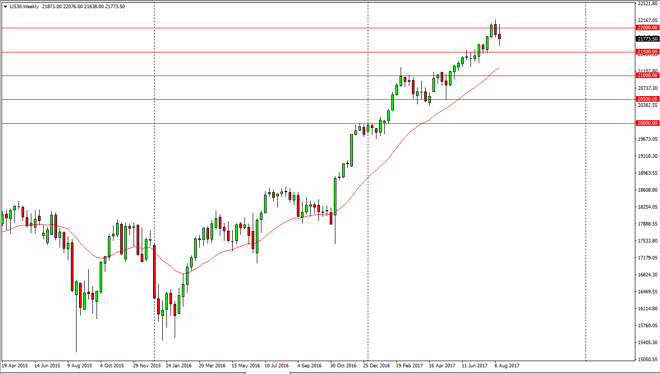
Dow Jones 30 The Dow Jones 30 had a volatile week, as we broke above the 22,000 level, but then turned around to form a somewhat neutral candle. This is a
The Dow Jones 30 had a volatile week, as we broke above the 22,000 level, but then turned around to form a somewhat neutral candle. This is a market that needs to pull back to pick up a little bit of bullish pressure, perhaps near the 21,500 level. If we can break above the top of the range for the week, the market should be willing to go even higher. However, we are bit over exerted.
The NASDAQ 100 also was very choppy, as the 5900 level above offered far too much in the way of resistance. However, it looks as if we are starting to find some interest in the market, so I think we could go higher, and a break above the top of the candle should finally free this market to go towards the 6000 handle. If we do break down below the 5700 level, the market will probably go to the 5500-level next.
Chris is a proprietary trader with more than 20 years of experience across various markets, including currencies, indices and commodities. As a senior analyst at FXEmpire since the website’s early days, he offers readers advanced market perspectives to navigate today’s financial landscape with confidence.