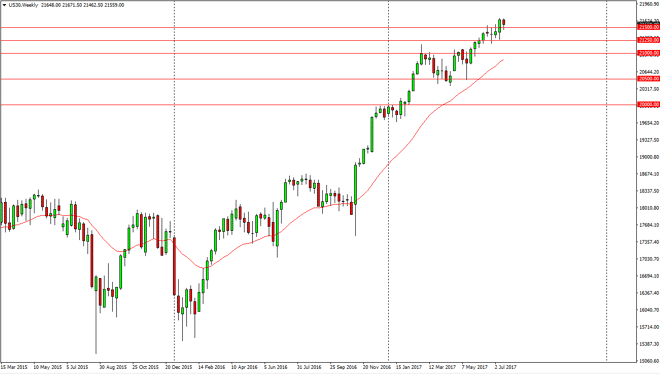
Dow Jones 30 The Dow Jones 30 initially fell during the week but found enough support underneath the 21,500 level to bounce and form a bit of a hammer. I
The Dow Jones 30 initially fell during the week but found enough support underneath the 21,500 level to bounce and form a bit of a hammer. I believe that the market will continue to go higher, as stock markets continue to benefit from a weaker US dollar. Ultimately, I believe that this is a buy on the dips type of situation, and that the 21,250-level underneath should offer significant support. I don’t have any interest in selling, I believe that there will continue to be buyers over the longer term as the weakening US dollar should continue to help US stocks overall, and of course the Dow Jones 30 will be any different. This is a market that should benefit from exports as heavy industrials continue to be favored.
The NASDAQ 100 rally during the week, slicing through the 5900 level. The fact that we broke above there suggests that we are going to go higher, perhaps reaching towards the 6000 level. I like pullbacks as buying opportunities, as this market continues to show bullish pressure and we have of course broken above significant resistance. Given enough time, I believe that we break above the 6000 level, and perhaps even higher than that. I believe that the 5700-level underneath will act as a “floor” in the market, and therefore have no interest whatsoever in shorting this market. The NASDAQ 100 lead the other US stock indices higher in the past, and I believe it will continue to do so in the future. Ultimately, the 6000 barrier will be something that is in the rearview mirror longer-term given enough time. Volatility continues, but the NASDAQ 100 continues to show the way higher.
Chris is a proprietary trader with more than 20 years of experience across various markets, including currencies, indices and commodities. As a senior analyst at FXEmpire since the website’s early days, he offers readers advanced market perspectives to navigate today’s financial landscape with confidence.