
Advertisement
Advertisement
Dow Jones 30 and NASDAQ 100 forecast for the week of March 27, 2017, Technical Analysis
Updated: Mar 25, 2017, 05:38 GMT+00:00
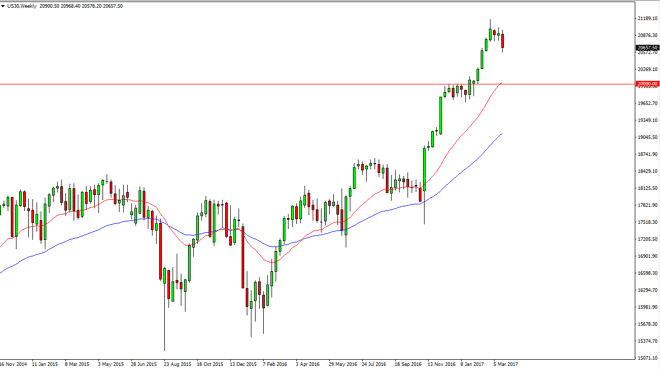
Dow Jones 30 The Dow Jones 30 fell significantly during the week, and it looks as if we are striding to pull back from some of the overextended conditions
Dow Jones 30
The Dow Jones 30 fell significantly during the week, and it looks as if we are striding to pull back from some of the overextended conditions we find ourselves in. Some type of supportive candle below would be a nice buying opportunity, and we could fall as low as 20,000 and still would look the same to me. I am looking for a supportive candle or a bounce to take advantage of the massive bullish trend, and therefore am simply on the sidelines waiting.
Dow Jones 30 and NASDAQ Index Video 27.3.17
NASDAQ 100
The NASDAQ 100 had a very volatile week, but we ended up forming a bit of a hammer. I think currently we are trying to build a bit of momentum, and eventually go higher. A break above the top of the hammer would be very bullish sign, but I believe that there is support all the way down to the 5175 handle. I have no interest in selling.
About the Author
Christopher Lewisauthor
Chris is a proprietary trader with more than 20 years of experience across various markets, including currencies, indices and commodities. As a senior analyst at FXEmpire since the website’s early days, he offers readers advanced market perspectives to navigate today’s financial landscape with confidence.


Advertisement