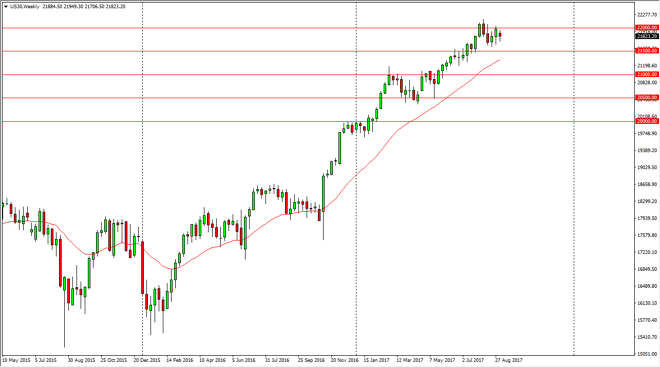
Dow Jones 30 The Dow Jones 30 gapped lower at the open on Monday, and then spent the rest of the week going back and forth. The 22,000-level offered
The Dow Jones 30 gapped lower at the open on Monday, and then spent the rest of the week going back and forth. The 22,000-level offered resistance, but I think eventually we will break above there. The 21,500-level underneath should offer support though. I believe the uptrend is very strong, but right now it looks like a market that is just simply grinding away to the upside. The fact that we are doing so in such a slow and gentle manner is a good sign, and I believe that eventually we will break out.
The NASDAQ 100 gapped lower initially during the week, and went back and forth as well. It looks as if the 5900 level underneath offered support, and I think we will continue to go higher. Given enough time, I expect this market to break above the 6000 handle, which would be a sign that we are going to the next leg out. I don’t have any interest in shorting, the uptrend line looks very supportive, and until we break significantly below there, I think that this is a “buy only” market.
Chris is a proprietary trader with more than 20 years of experience across various markets, including currencies, indices and commodities. As a senior analyst at FXEmpire since the website’s early days, he offers readers advanced market perspectives to navigate today’s financial landscape with confidence.