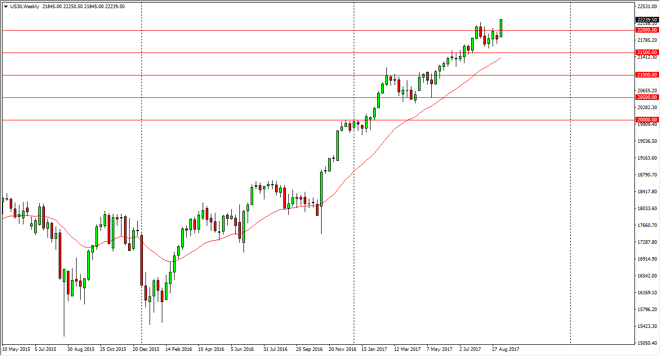
Dow Jones 30 The Dow Jones 30 broke out to the upside, slicing through the 22,000 level during the week. In fact, we are closing towards the top of the
The Dow Jones 30 broke out to the upside, slicing through the 22,000 level during the week. In fact, we are closing towards the top of the range for the week, and therefore I think that the Dow Jones 30 continues to go much higher. Because of this, I am a buyer of dips, and I believe that holding onto this position is probably about the best thing that we can do. The 21,500-level underneath should be support.
The NASDAQ 100 rallied a bit during the day, reaching towards the 6000 level. If we can break above there, the market should continue to go much higher. If we pull back from here, I think that the 5900-level underneath will be support, offering value the traders will take advantage of. The NASDAQ looked especially strong on Friday, and I think we are going to see a continued bullish pressure in this market.
Chris is a proprietary trader with more than 20 years of experience across various markets, including currencies, indices and commodities. As a senior analyst at FXEmpire since the website’s early days, he offers readers advanced market perspectives to navigate today’s financial landscape with confidence.