Advertisement
Advertisement
Dow Jones 30 and NASDAQ 100 Price Forecast August 9, 2017, Technical Analysis
Updated: Aug 9, 2017, 05:06 GMT+00:00
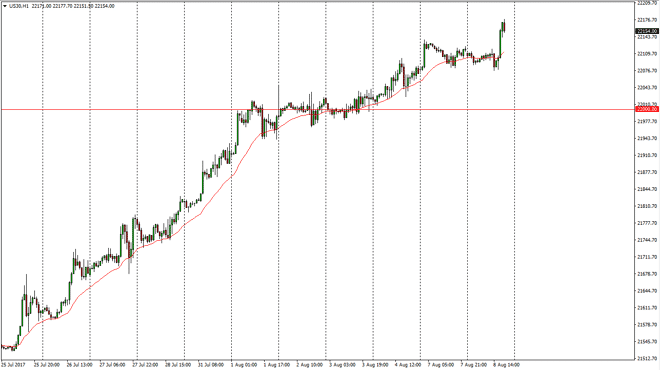
Dow Jones 30 The Dow Jones 30 initially went sideways during Tuesday, but the Americans came aboard and pushed the market to the upside. In fact, we broke
Dow Jones 30
The Dow Jones 30 initially went sideways during Tuesday, but the Americans came aboard and pushed the market to the upside. In fact, we broke above the 22,150 level, and although we are pulling back a little bit during the trading session, we should see plenty of support underneath. Given enough time, the market should continue to find buyers, and the longer-term bullish run should continue. The 22,000 level underneath is massively supportive, and I believe will continue to act as a “floor” in the market.
Dow Jones 30 and NASDAQ Index Video 09.8.17
NASDAQ 100
The NASDAQ 100 initially fell, but found buyers to turn things around and break above the 5950 handle. It looks as if are trying to pull back, but I think that there will be buyers underneath and I think at that point will probably go looking towards the 6000 handle to the upside, as the market tends to look for the large, round, significant numbers.
About the Author
Christopher Lewisauthor
Chris is a proprietary trader with more than 20 years of experience across various markets, including currencies, indices and commodities. As a senior analyst at FXEmpire since the website’s early days, he offers readers advanced market perspectives to navigate today’s financial landscape with confidence.
Advertisement
