Advertisement
Advertisement
Dow Jones 30 and NASDAQ 100 Price Forecast July 10, 2017, Technical Analysis
Updated: Jul 8, 2017, 06:25 GMT+00:00
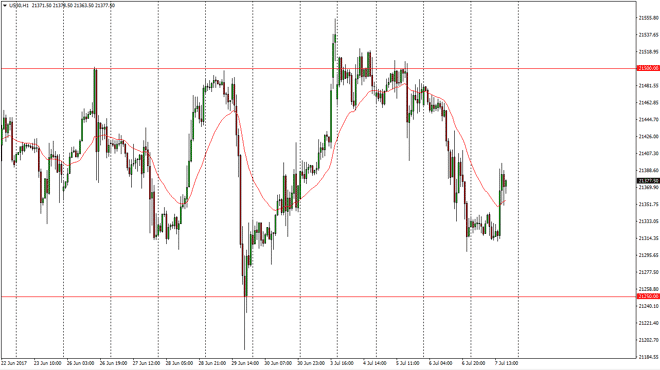
Dow Jones 30 The Dow Jones 30 went sideways initially during the day on Friday, but after the jobs number came out, the Dow Jones 30 went much higher,
Dow Jones 30
The Dow Jones 30 went sideways initially during the day on Friday, but after the jobs number came out, the Dow Jones 30 went much higher, showing signs of resiliency. The market seems to be using the 21,350 level as support, and should eventually go much higher, perhaps reaching towards the 21,400 level, and then eventually the 21,500 level. A break above that area should send this market much higher, as it would show a significant amount of resiliency in the Dow Jones 30 which has seen quite a bit of bullish pressure over the longer term. Markets seem to be offering “buy on the dips” opportunities, and I will take advantage of those as we go higher.
Dow Jones 30 and NASDAQ Index Video 10.7.17
NASDAQ 100
The NASDAQ 100 went sideways initially during the session as well, but had a similar reaction after the jobs number. We shot much higher, and it now looks as if the NASDAQ 100 is trying to break out to the upside. If we can continue the upward pressure, I believe we go to the 5700 level. A break above there is very bullish and should continue to push this market to the upside longer term. The NASDAQ 100 has been one of the more bullish markets in general, and I believe that will continue to be the case going forward although we may have seen a bit of sector rotation into the industrials, favoring the Dow Jones 30. Either way, I believe that this market continues to show buying opportunities on pullbacks, as we have most certainly seen a lot of buying pressure. The NASDAQ 100 should continue to be a positive market overall, and I think will eventually try to break above the 5700 level, and then go looking towards the 6000 level.
About the Author
Christopher Lewisauthor
Chris is a proprietary trader with more than 20 years of experience across various markets, including currencies, indices and commodities. As a senior analyst at FXEmpire since the website’s early days, he offers readers advanced market perspectives to navigate today’s financial landscape with confidence.
Advertisement
