
Advertisement
Advertisement
Dow Jones 30 and NASDAQ 100 Price Forecast November 16, 2017, Technical Analysis
Updated: Nov 16, 2017, 08:46 GMT+00:00
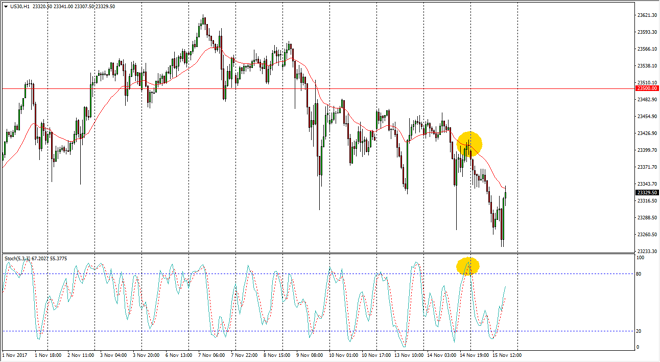
Dow Jones 30 The Dow Jones 30 fell immediately during the trading session on Wednesday, reaching down as low as the 23,250 region, before bouncing
Dow Jones 30
The Dow Jones 30 fell immediately during the trading session on Wednesday, reaching down as low as the 23,250 region, before bouncing significantly. However, the 24-hour exponential moving average is offering dynamic resistance, and I have marked on the chart something that I noticed yesterday, the stochastic oscillator crossing in the overbought condition, which shows a significant amount of stagnation. I think that this market, much like many other stock markets, needs to pull back to find value underneath. That being said, I am not a seller the Dow Jones 30 because I believe in the longer-term uptrend. If you are nimble enough, you could be a short seller, but I would do that with very small position sizing. As for going long, I need to see a higher timeframe give me the signal to start buying.
Dow Jones 31 and NASDAQ Index Video 16.11.17
NASDAQ 100
The NASDAQ 100, of course, did the exact same thing, as algorithms turned the market back around near the 6225 level. There is a significant amount of resistance above, and extending to the 6300 level, so I don’t have any interest in trying to go long of the market until we were to break the 6325 handle, something that I don’t expect to see today. I think that the market probably continues to drop a bit, perhaps finding enough support at the 6200 level to turn things around. During the past year or 2, the NASDAQ 100 typically will lead the other US indices higher, so I’m waiting to see this market rally as it is a bit of a tertiary indicator for my other stock market indices in America. Right now, I believe that the stock market in general needs to cool off and build a bit of a base as we had gotten ahead of ourselves.
About the Author
Christopher Lewisauthor
Chris is a proprietary trader with more than 20 years of experience across various markets, including currencies, indices and commodities. As a senior analyst at FXEmpire since the website’s early days, he offers readers advanced market perspectives to navigate today’s financial landscape with confidence.


Advertisement