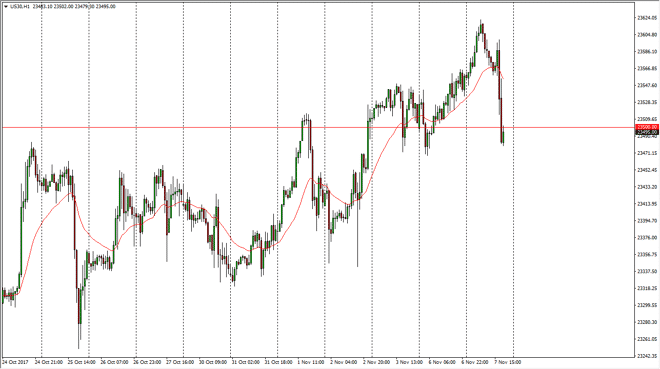
Dow Jones 30 The Dow Jones 30 fell significantly during the day on Tuesday, breaking below the 23,500 handle. This is an area that should be supportive,
The Dow Jones 30 fell significantly during the day on Tuesday, breaking below the 23,500 handle. This is an area that should be supportive, but I think it also extends down a couple of hundred points. I’m waiting to see some type of bounce, or perhaps a move back above the 23,500 level before I would start to buy. The market should continue to find buyers underneath, near the 23,350 level, and perhaps even lower than that. Longer-term, I anticipate that the Dow Jones 30 will eventually reach the 25,000 handle, but that probably won’t be until spring of 2018. I have no interest in shorting unless of course, we were to break down below the 23,000 handle. I suspect that buyers are willing to be patient enough to pick up value at lower levels, as the market certainly continue to offer support.
The NASDAQ 100 has fallen a bit during the day on Tuesday, reaching down towards the 6300 level. We are testing the 24-hour exponential moving average, and of course the sideways support at 6300. I think that we could probably continue to go the little bit lower though, and quite frankly I would love to see that, as it would offer value in a market that has been very bullish. Longer-term, I believe that we will go looking towards the 6500 level above, which would be much more structural resistance. I believe in buying on the dips, but I also believe that the dips need to be a bit more substantial. I have no interest whatsoever in trying to short this market, I believe that the overall uptrend should continue, but we have simply become a bit too expensive for me to put money to work.
Chris is a proprietary trader with more than 20 years of experience across various markets, including currencies, indices and commodities. As a senior analyst at FXEmpire since the website’s early days, he offers readers advanced market perspectives to navigate today’s financial landscape with confidence.