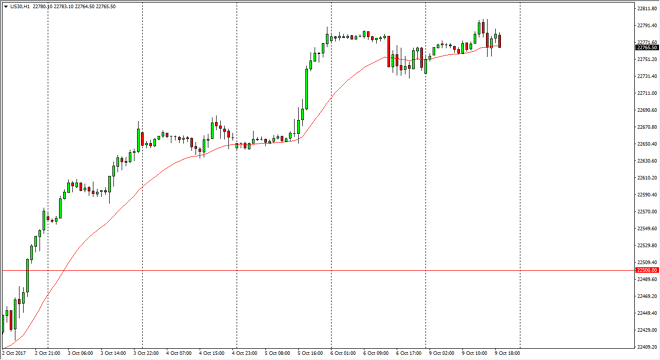
Dow Jones 30 The Dow Jones 30 went sideways during the Monday trading session as we continue to hover around the 22,750 level. By doing so, it looks as if
The Dow Jones 30 went sideways during the Monday trading session as we continue to hover around the 22,750 level. By doing so, it looks as if the market is trying to catch his breath after a significant run higher, and I believe that the markets pulling back at this point should be buying opportunities. I believe that the 22,500-level underneath should be a bit of a “floor” in the market, and I also believe that eventually, we will go to the 23,000 level above. The markets remain bullish overall, but after the significant moves, we have needed to catch our breath and build up momentum for continued bullish pressure. The Dow Jones 30 is highly influenced by industrials, which of course has seen money flow into them as of late. I believe the Dow Jones 30 should continue to show signs of bullish pressure.
The NASDAQ 100 was slightly bullish during the day on Monday, but quite frankly is looking to build up momentum in this area. I believe that the 6000-level underneath is massively supportive, as it was massively resistant in the past. Ultimately, the market should go looking towards the 6100 level above, which will attract a lot of attention. I think that technology has sold off rather significantly, and now is starting to get more money flowing into it again. With that being the case, the market should continue to be choppy, but I believe that it’s only a matter of time before we find reason enough to go long again. Pay attention to Facebook, Apple, Netflix, and Google. They will all have a massive effect on how the NASDAQ 100 moves. Ultimately, they make up over a quarter of the value of the NASDAQ 100, so essentially your trading those 4 stocks. They all look as if they are starting to come back into favor.
Chris is a proprietary trader with more than 20 years of experience across various markets, including currencies, indices and commodities. As a senior analyst at FXEmpire since the website’s early days, he offers readers advanced market perspectives to navigate today’s financial landscape with confidence.