
Advertisement
Advertisement
E-mini Dow Jones Industrial Average (YM) Futures Analysis – August 13, 2015 Forecast
By:
September E-mini Dow Jones Industrial Average futures posted a potentially bullish closing price reversal bottom on Wednesday. The chart pattern was
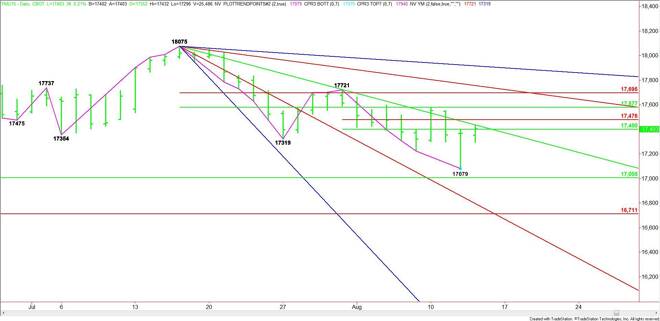
September E-mini Dow Jones Industrial Average futures posted a potentially bullish closing price reversal bottom on Wednesday. The chart pattern was confirmed during the pre-market session, giving the Dow an early upside bias.
Based on the short-term range of 17721 to 17079, the first objective is the retracement zone at 17400 to 17476. This zone is currently being tested. A downtrending angle also passes through this zone at 17435, making it a valid target also. Trader reaction to this area will set the tone for the day.
The main range is 18075 to 17079. Its retracement zone at 17577 to 17695 is the next upside target. This area is followed by a downtrending angle at 17755.
The last potential resistance angle before the 18075 main top comes in at 17915.
Watch the order flow and read the price action at 17400 to 17476. This will tell us whether the bulls or the bears are in control.
About the Author
James Hyerczykauthor
James Hyerczyk is a U.S. based seasoned technical analyst and educator with over 40 years of experience in market analysis and trading, specializing in chart patterns and price movement. He is the author of two books on technical analysis and has a background in both futures and stock markets.


Advertisement