
Advertisement
Advertisement
E-mini Dow Jones Industrial Average (YM) Futures Analysis – August 14, 2015 Forecast
By:
September E-mini Dow Jones Industrial Average futures are called slightly lower shortly before the cash market opening. The main trend is down according
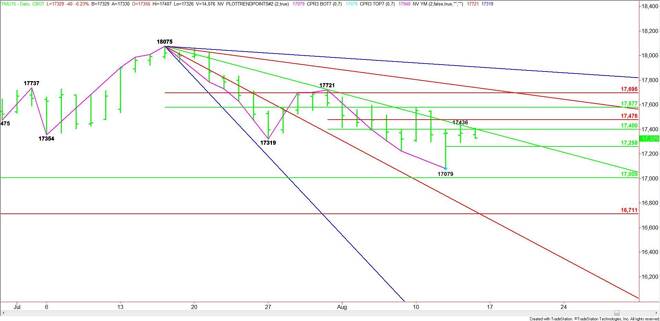
September E-mini Dow Jones Industrial Average futures are called slightly lower shortly before the cash market opening. The main trend is down according to the daily swing chart and it looks as if sellers came in to defend the trend on a test of a short-term retracement zone yesterday and during the pre-market session.
The main range is 18075 to 17079. Its retracement zone is 17577 to 17695. This area is a potential resistance zone.
The intermediate range is 17721 to 17079. Its retracement zone is 17400 to 17476. This zone stopped the rally earlier in the session when the Dow reached a high of 17436.
A downtrending angle from the 18075 top also played a role in stopping the rally. This angle is at 17403 today. It forms a resistance cluster with the intermediate 50% level at 17400.
A sustained move under 17403 should lead to a test of the short-term pivot at 17258. This price is also controlling the short-term direction of the market.
A trade through 17258 could trigger a steep sell-off with nothing in the way until 17079. Taking out this price will negate the closing price reversal bottom. The next level under this is a major 50% level at 17005.
If 17258 holds then look for a possible return rally back to 17400 to 17403. Taking out 17403 and sustaining the move could trigger a further rally into a Fib level at 17476 then a 50% level at 17577. This is also a trigger point for an upside breakout into the Fib level at 17695 and the main top at 17721. A trade through 17721 will turn the main trend to up.
Watch and read the price action and order flow at 17400 to 17403 early in the session. Trader reaction to this area will set the tone for the day. The next decision point will be 17258. Trader reaction to this level will also let us know if the bulls or the bears are in control.
About the Author
James Hyerczykauthor
James Hyerczyk is a U.S. based seasoned technical analyst and educator with over 40 years of experience in market analysis and trading, specializing in chart patterns and price movement. He is the author of two books on technical analysis and has a background in both futures and stock markets.


Advertisement