
Advertisement
Advertisement
E-mini Dow Jones Industrial Average (YM) Futures Analysis – August 19, 2015 Forecast
By:
September E-mini Dow Jones Industrial Average futures are expected to open lower based on the pre-market session and the miss to the downside by the U.S.
September E-mini Dow Jones Industrial Average futures are expected to open lower based on the pre-market session and the miss to the downside by the U.S. consumer inflation data. Traders are now shifting their focus on the release of the latest Fed minutes at 2:00 p.m. ET. This will give traders some guidance as to the timing of the first Fed rate hike since 2006.
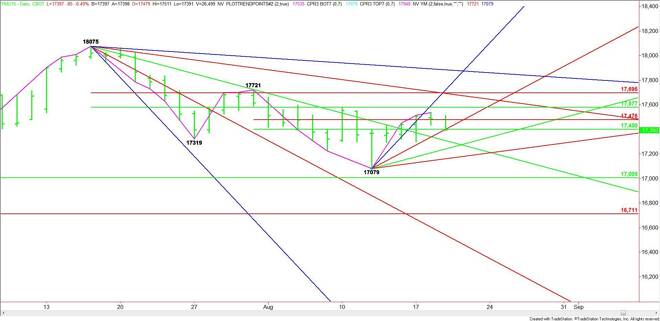
The main trend is down on the daily swing chart. The short-term range is 17721 to 17079. Its retracement zone at 17400 to 17476 is currently providing resistance.
An uptrending angle comes in at 17399. This angle forms a price cluster with the 50% level at 17400. Trader reaction to this zone will determine the direction of the market today.
A sustained move under 17399 will indicate the presence of sellers. This could create enough downside momentum to challenge the next uptrending angle at 17239. The last angle before the 17079 main bottom comes in at 17159.
A trade through 17079 will reaffirm the downtrend. The next target under this price is the major 50% level at 17005.
The daily chart opens up substantially under 17005 with the next potential target the Fibonacci level at 16711.
Holding 17400 will indicate the presence of buyers with the next target the short-term Fibonacci level at 17476. This is followed by an intermediate 50% level at 17577 and a 61.8% level at 17695.
The 61.8% level also forms a potential resistance cluster with a downtrending angle at 17691, making 17691 to 17695 the best upside target.
Watch the price action and read the order flow at 17399 to 17400. This will tell us whether the bulls or the bears are in control.
About the Author
James Hyerczykauthor
James Hyerczyk is a U.S. based seasoned technical analyst and educator with over 40 years of experience in market analysis and trading, specializing in chart patterns and price movement. He is the author of two books on technical analysis and has a background in both futures and stock markets.


Advertisement