
Advertisement
Advertisement
E-mini Dow Jones Industrial Average (YM) Futures Analysis – August 5, 2015 Forecast
By:
September E-mini Dow Jones Industrial Average futures are trading higher after recovering from early session weakness. The market is testing a short-term
September E-mini Dow Jones Industrial Average futures are trading higher after recovering from early session weakness. The market is testing a short-term pivot price shortly before the cash market opening. Trader reaction to this price should set the tone for the day.
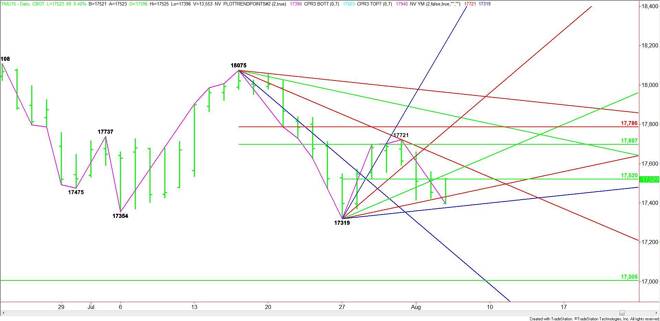
Based on the current price at 17523, the nearest support angles come in at 17431 and 17375. The latter is the last potential support before the 17319 main bottom. The daily chart opens up to the downside under 17319 with the next potential target a steep downtrending angle at 17179.
The main trend is down according to the daily swing chart. The short-term range is 17319 to 17721. Its 50% level or pivot at 17520 is controlling the short-term direction of the market. Trader reaction to 17520 should determine the direction of the market today.
A sustained move over 17520 will signal the presence of buyers. The first target is an uptrending angle at 17543. Crossing to the bullish side of this angle will likely trigger a fast rally into the downtrending angle at 17627. Look for resistance on the first test of this angle, but be prepared for an acceleration to the upside if this angle is taken out with conviction.
The main range is 18075 to 17319. Overtaking the angle at 17627 will likely lead to a test of its retracement zone at 17697 to 17786. The last main top at 17721 falls inside this zone. Since the main trend is down, sellers are likely to come in to defend the trend on a test of this zone.
A trade through 17721 will turn the main trend to up. This could trigger a fast rally into the Fibonacci level at 17786.
Watch and read the order flow and price action at 17520. This should tell us whether the bulls or the bears are in control.
About the Author
James Hyerczykauthor
James Hyerczyk is a U.S. based seasoned technical analyst and educator with over 40 years of experience in market analysis and trading, specializing in chart patterns and price movement. He is the author of two books on technical analysis and has a background in both futures and stock markets.


Advertisement