
Advertisement
Advertisement
E-mini Dow Jones Industrial Average (YM) Futures Analysis – November 13, 2015 Forecast
By:
December E-mini Dow Jones industrial Average futures are trading lower during the pre-market session as investors prepare for the release of the latest
December E-mini Dow Jones industrial Average futures are trading lower during the pre-market session as investors prepare for the release of the latest U.S. retail sales data. Volume and volatility are expected to increase with the release of the report.
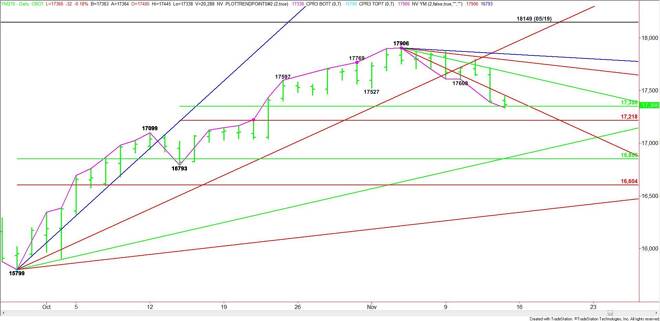
The main trend is up according to the daily swing chart, but momentum has been trending lower since November 4.
The short-term range is 16793 to 17906. Its retracement zone is 17350 to 17218. The upper or 50% level at 17350 is currently being tested. Trader reaction to this level is likely to determine the tone of the market today.
A sustained move over 17350 will signal the presence of buyers. The first upside target and trigger point for an acceleration to the upside is the steep downtrending angle at 17458.
Taking out 17458 could trigger an acceleration into the next downtrending angle at 17682. This angle is important because it has acted like resistance since the 17906 top on November 4.
Taking out 17906 could trigger a further rally into a pair of downtrending angles at 17794 and 17850. The latter is the last potential resistance angle before the 17906 main top.
A sustained move under 17350 will indicate the presence of sellers. This could trigger a fast break into the Fibonacci level at 17218.
The Fib level is a trigger point for a steep break down. Taking out this level with conviction could trigger an eventual break into a long-term uptrending angle at 16855.
The main range is 15799 to 17906. Its retracement zone at 16853 to 16604 is the primary downside target. The angle at 16855 forms a support cluster with the 50% level at 16853, making it the best downside target today. Look for a strong rebound rally if this area is tested.
Watch the price action and read the order flow at 17350. Trader reaction to this level will tell us whether the bulls or the bears are in control.
About the Author
James Hyerczykauthor
James Hyerczyk is a U.S. based seasoned technical analyst and educator with over 40 years of experience in market analysis and trading, specializing in chart patterns and price movement. He is the author of two books on technical analysis and has a background in both futures and stock markets.


Advertisement