
Advertisement
Advertisement
E-mini Dow Jones Industrial Average (YM) Futures Analysis – October 24, 2014 Forecast
By:
December E-mini Dow Jones Industrial Average futures rallied on Thursday after failing to confirm the previous day’s potentially bearish closing price
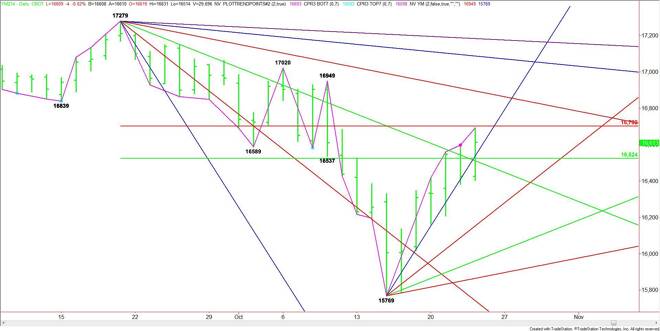
December E-mini Dow Jones Industrial Average futures rallied on Thursday after failing to confirm the previous day’s potentially bearish closing price reversal top. The chart pattern was formed in response to an outside event so the pressure came from defensive selling rather than new short-selling.
The main range is 17279 to 15769. The retracement zone formed by this range is 16524 to 16702. The lower or 50% level is new support zone while the upper or Fibonacci level is resistance.
Also providing support is a steep uptrending angle from the 15769 bottom at 16665.
The daily chart indicates there is plenty of room to the upside if 16702 is taken out with conviction. The next likely target is a downtrending angle at 16879, followed by a pair of main tops at 16949 and 17020. A trade through this levels will turn the main trend to up.
On the downside, the first sign of weakness will be a break under the angle at 16665. Taking out the 50% level at 16524 will be the next. Look for an acceleration to the downside to begin on a sustained move under the downtrending angle at 16479.
The tone of the market today is likely to be determined by trader reaction to the Fib level at 16702. This price may act like a pivot at times today.
About the Author
James Hyerczykauthor
James Hyerczyk is a U.S. based seasoned technical analyst and educator with over 40 years of experience in market analysis and trading, specializing in chart patterns and price movement. He is the author of two books on technical analysis and has a background in both futures and stock markets.


Advertisement