
Advertisement
Advertisement
E-mini NASDAQ-100 Index (NQ) Futures Technical Analysis – August 5, 2015 Forecast
By:
September E-mini NASDAQ-100 Index futures are trading higher shortly ahead of the cash market opening. Over the last three days the index has been
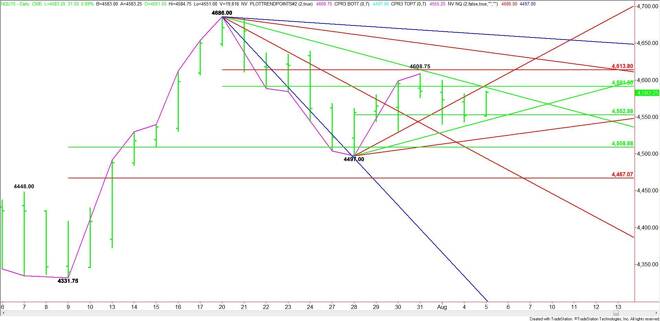
September E-mini NASDAQ-100 Index futures are trading higher shortly ahead of the cash market opening. Over the last three days the index has been consolidating between a pair of 50% levels. This suggests investor indecision, but also impending volatility.
The main trend is up according to the daily swing chart.
Three ranges are influencing the price action. The first is 4331.75 to 4686.00. Its retracement zone at 4508.75 to 4467.00 provided support last week.
The second range is 4686.00 to 4497.00. Its retracement zone at 4591.50 to 4613.75 stopped the rally last week when the index traded up to 4608.75.
The new short-term range is 4497.00 to 4608.75. Its 50% level or pivot is 4552.75. This price has provided support this week. Trader reaction to this level is likely to set the tone for the day and perhaps the rest of the week.
Based on the pre-market trade, the first support area is a 50% level at 4552.75 and an uptrending angle at 4545.00. The market opens up to the downside under this level with potential targets at 4521.00 and 4508.75. The next main bottom is 4497.00. A trade through this bottom will turn the main trend to down.
A resistance cluster comes in at 4590.00, 4591.50 and 4593.00, making it the primary upside target. Sellers could come in on the initial test of this zone, but keep in mind this type of cluster is also a trigger point for an upside breakout.
Taking out 4593.00 could fuel a rally into the minor top at 4608.75 then the Fibonacci level at 4613.75. The next resistance angles over the Fib come in at 4638.00 and 4662.00. The latter is the last angle before the 4686.00 main bottom.
The direction of the market today will likely be determined by trader reaction to 4593.00. Watch and read the price action and order flow at the 4590.00 to 4593.00 resistance cluster. This will tell us the strength of the buying and selling.
About the Author
James Hyerczykauthor
James Hyerczyk is a U.S. based seasoned technical analyst and educator with over 40 years of experience in market analysis and trading, specializing in chart patterns and price movement. He is the author of two books on technical analysis and has a background in both futures and stock markets.


Advertisement