
Advertisement
Advertisement
E-mini NASDAQ-100 Index (NQ) Futures Technical Analysis – November 20, 2015 Forecast
By:
December E-mini NASDAQ-100 Index futures closed higher on Thursday, but there wasn’t much movement during the U.S. session which suggests all of the early
December E-mini NASDAQ-100 Index futures closed higher on Thursday, but there wasn’t much movement during the U.S. session which suggests all of the early buying came from Asia and Europe. This may be a sign that U.S. investors aren’t interested in chasing this market higher and would rather buy in a value area.
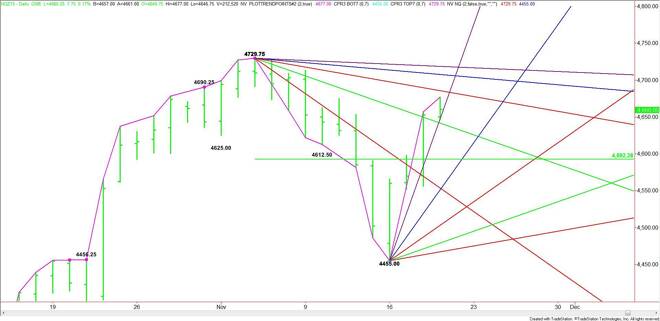
Technically, the main trend is up according to the daily swing chart and momentum is also moving higher. The index is also trading well above the near-term 50% level, giving it a strong upside bias.
Based on the close at 4660.00, the key angle to watch comes in at 4711.00. This angle, moving up 64 points per day from the 4455.00 bottom, has been guiding the index higher for four days. A failure to sustain a move over this angle will indicate that upside momentum is weakening.
The first upside target is a downtrending angle at 4681.75. This is followed by another downtrending angle at 4705.75 and the aforementioned uptrending angle at 4711.00.
The last potential support angle before the 4729.75 main top comes in at 4717.75.
The inability to maintain the upside momentum at its current pace will signal that the buying is slowing or that the selling is increasing. This could trigger a break into a downtrending angle at 4633.75.
The daily chart opens up to the downside under 4633.75. This could lead to the start of a steep sell-off with the 50% level at 4592.25 the next target followed by a steep uptrending angle at 4583.00.
Watch the price action on the opening. A steady opening at 4660.00 will put the index on the weak side of the steep angle that had been guiding it higher. Traders are going to have to make a decision to go after the nearest resistance angle at 4681.75 or the nearest minor support at 4633.75.
The chart indicates that the way of least resistance is down. Any rally is likely to be labored.
About the Author
James Hyerczykauthor
James Hyerczyk is a U.S. based seasoned technical analyst and educator with over 40 years of experience in market analysis and trading, specializing in chart patterns and price movement. He is the author of two books on technical analysis and has a background in both futures and stock markets.


Advertisement