December E-mini NASDAQ-100 Index futures inched higher on Tuesday, supported by gains in Tech stocks. The NASDAQ-100 Cash Index closed about 0.3 percent
December E-mini NASDAQ-100 Index futures inched higher on Tuesday, supported by gains in Tech stocks. The NASDAQ-100 Cash Index closed about 0.3 percent higher at 4719.05, topping its previous record close set in March 2000. The intraday of the cash index is the next upside target at 4816.35. The key stocks for the day were Microsoft and Apple.
Despite the rally, buyers still appeared to be tentative to take major positions across the board ahead of Friday’s major U.S. Non-Farm Payrolls report. This suggests that yesterday’s price action was driven more by sector rotation rather than outright buying.
The main trend is up according to the daily swing chart. However, the index is still in the window of time for a potentially bearish closing price reversal top so traders still have to be a little careful about buying strength this week especially ahead of Friday’s U.S. Non-Farm Payrolls report.
A reversal top is likely to signal a short-term correction is imminent, not necessarily a change in trend. It may just be position-squaring ahead of the jobs report rather than outright shorting. Although there are likely to be those aggressive sellers who will take positions because of the historical price level.
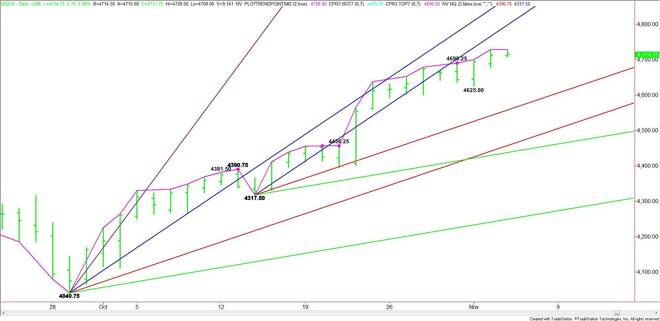
Technically, the main trend is up according to the daily swing chart.
Based on the close at 4712.00, the major upside target is a steep, short-term uptrending angle at 4797.50.
Taking out yesterday’s high at 4727.50 will put the market in a position to continue the rally or lead to a closing price reversal top.
A sustained rally over 4727.50 will indicate the presence of buyers. Taking out this level then breaking back below yesterday’s close at 4712.00 will indicate the presence of sellers. This will signal the start of a closing price reversal top.
Watch the price action and read the order flow at 4727.50 today. Trader reaction to this level will tell us whether the bulls or the bears are in control.
James Hyerczyk is a U.S. based seasoned technical analyst and educator with over 40 years of experience in market analysis and trading, specializing in chart patterns and price movement. He is the author of two books on technical analysis and has a background in both futures and stock markets.