
Advertisement
Advertisement
E-mini NASDAQ-100 Index (NQ) Futures Technical Analysis – November 5, 2015 Forecast
By:
December E-mini NASDAQ-100 Index futures posted a potentially bearish closing price reversal top on Wednesday. The chart pattern indicates the selling is
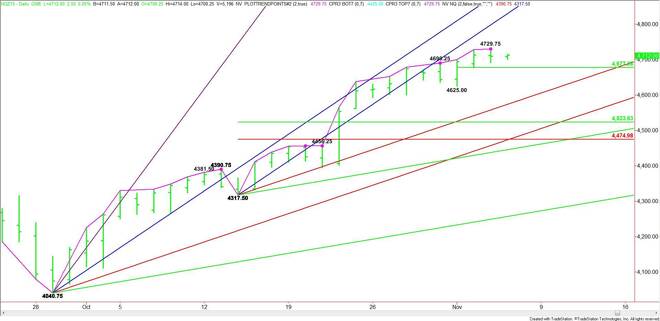
December E-mini NASDAQ-100 Index futures posted a potentially bearish closing price reversal top on Wednesday. The chart pattern indicates the selling is greater than the buying at current price levels, but not necessarily the start of a change in trend. It was most likely fueled by profit-taking and position-squaring ahead of Friday’s U.S. Non-Farm Payrolls report.
A trade through 4691.25 will confirm the closing price reversal top. However, don’t expect too much of a break initially. The short-term range is 4625.00 to 4729.75. Its 50% level or pivot price is 4677.25. Although a break through 4691.25 will give the index a bearish tone, the direction of the market today is likely to be determined by trader reaction to the pivot.
A sustained move over 4677.25 will indicate the presence of buyers. However, don’t expect an upside breakout unless 4729.75 is taken out with conviction and the move is accompanied by better-than-average volume.
A sustained move under 4677.25 will signal the presence of sellers. The daily chart opens up to the downside under this level with the next target this week’s low at 4625.00.
Looking ahead to when volume and volatility return to normal, taking out 4625.00 could trigger an acceleration into the next major uptrending angle at 4573.50.
If 4717.50 to 4729.75 becomes the main range then its retracement zone at 4523.50 to 4475.00 will become the primary downside target.
There are going to be several “reads” today because it looks as if volume is going be low and momentum may have shifted to the downside on Wednesday.
The first read it yesterday’s low at 4691.25. Look for a downside bias to develop if this level is taken out since it will confirm the reversal top.
The second read is the short-term pivot at 4677.25. Trader reaction to this level will tell us about the strength of the buying and selling.
The third read is the closing price reversal top at 4729.75. Taking out this level will negate the chart pattern and indicate that there are still investors in there willing to buy strength.
About the Author
James Hyerczykauthor
James Hyerczyk is a U.S. based seasoned technical analyst and educator with over 40 years of experience in market analysis and trading, specializing in chart patterns and price movement. He is the author of two books on technical analysis and has a background in both futures and stock markets.


Advertisement