
Advertisement
Advertisement
E-mini NASDAQ-100 Index (NQ) Futures Technical Analysis – November 9, 2015 Forecast
By:
December E-mini NASDAQ-100 Index futures are trading flat-to-slightly lower, shortly before the cash market opening. The market sold-off for a couple of
December E-mini NASDAQ-100 Index futures are trading flat-to-slightly lower, shortly before the cash market opening. The market sold-off for a couple of hours after the release of the stronger-than-expected U.S. Non-Farm Payrolls report on Friday before mounting a rebound rally which put it higher for the day.
Friday’s price action suggests investors still aren’t sure what to do at current price levels. The odds of a December rate hike jumped from 50% to 70% on Friday. This still gives aggressive investors room to try to squeeze a few more bucks out of the rally. Some investors, however, may feel that buying strength is too risky at current price levels. These investors likely prefer to buy a break into a value zone.
There will be Fed speakers this week before Friday’s most important U.S. retail sales report. The Fed members are expected to have a hawkish tone in their speeches. This could lead to selling pressure because higher interest rates will likely mean that some investors will take money out of stocks and invest in Treasurys. Those supporting the market are citing the strong economy as the main reason to sustain the upside bias.
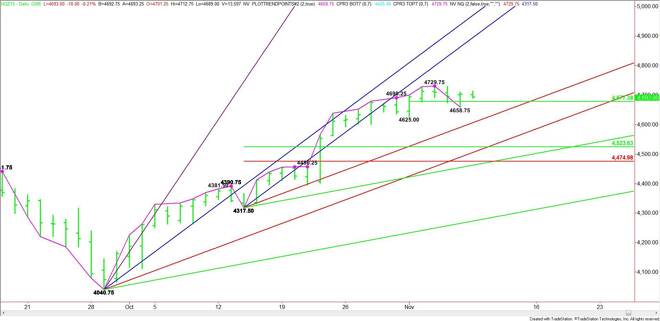
Technically, the main trend is up according to the daily swing chart. However, the pivot price of a minor range is the key level to watch today. The minor range is 4625.00 to 4729.75. Its pivot is 4677.25. This level is controlling the direction of the market.
A sustained move over 4677.25 will indicate the presence of buyers. This may create enough upside momentum to trigger a rally into last week’s high at 4729.75.
The high at 4792.75 could be a trigger point for an acceleration to the upside. The next potential target is a steep uptrending angle at 4605.50.
A sustained move under 4677.25 will signal the presence of sellers. There could be a labored break, however, because of Friday’s low at 4658.75 and last week’s low at 4625.00. These are followed by a short-term uptrending angle at 4605.50.
If 4317.50 to 4729.75 becomes the new main range then the primary downside objective becomes 4523.50 to 4475.00. This is the nearest value zone.
Watch the price action and read the order flow at 4677.25 today. Trader reaction to this level will tell us whether the bulls or the bears are in control.
About the Author
James Hyerczykauthor
James Hyerczyk is a U.S. based seasoned technical analyst and educator with over 40 years of experience in market analysis and trading, specializing in chart patterns and price movement. He is the author of two books on technical analysis and has a background in both futures and stock markets.


Advertisement