
Advertisement
Advertisement
E-mini NASDAQ-100 Index (NQ) Futures Technical Analysis – October 1, 2014 Forecast
By:
December E-mini NASDAQ-100 Index futures posted a higher-high and higher-low, leading to a higher close. Unfortunately for the bullish traders, the market
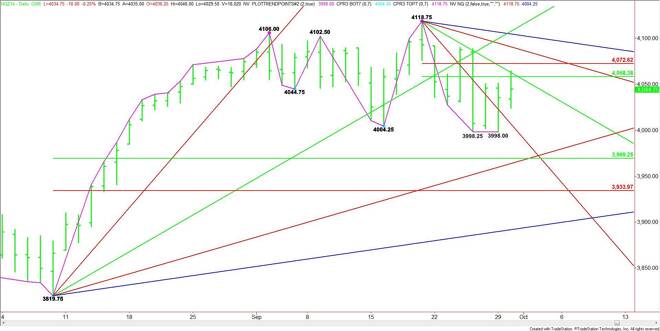
December E-mini NASDAQ-100 Index futures posted a higher-high and higher-low, leading to a higher close. Unfortunately for the bullish traders, the market ran into retracement zone resistance so the rally was capped. Since the main trend is down on the daily chart, short-sellers likely came in at the retracement zone to defend the trend. This is the key area to watch today.
The short-term range is 4118.75 to 3998.00. The retracement zone and current resistance area is 4058.50 to 4072.75. The tone of the market today will be determined by trader reaction to this zone.
Downtrending resistance comes in today at 4054.75. Overtaking the retracement zone could trigger a rally into the next two angles at 4086.75 and 4102.75.
Taking out 3998.00 will reaffirm the downtrend. Crossing to the weak side of a steep angle at 3990.75 will be a sign of stronger selling pressure.
The main range is 3819.75 to 4118.75. This makes its retracement zone at 3969.25 to 3934.00 the next major downside target. A long-trending angle from the 3819.75 bottom at 3967.75 forms an important support cluster, making it a prime downside target.
Trader reaction to 4058.50 will determine if the buying is real, but don’t expect a bullish tone to develop until the Fibonacci level at 4072.75 is taken out with conviction. A failure at 4058.50 to 4072.75 will form a potentially bearish secondary lower top. This could lead to an eventual break into 3969.25 to 3934.00.
About the Author
James Hyerczykauthor
James Hyerczyk is a U.S. based seasoned technical analyst and educator with over 40 years of experience in market analysis and trading, specializing in chart patterns and price movement. He is the author of two books on technical analysis and has a background in both futures and stock markets.


Advertisement