
Advertisement
Advertisement
E-mini Russell 2000 Index (TF) Futures Technical Analysis – August 11, 2015 Forecast
By:
September E-mini Russell 2000 Index futures are trading sideways-to-lower shortly before the cash market opening. There was no follow-through move after
September E-mini Russell 2000 Index futures are trading sideways-to-lower shortly before the cash market opening. There was no follow-through move after yesterday’s rally and the pre-market session traded inside yesterday’s range.
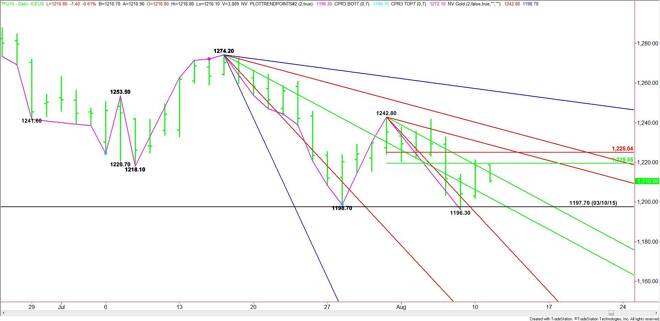
The main trend is down according to the daily swing chart. The main range is 1242.80 to 1196.30. Its retracement zone is 1219.60 to 1225.00. Yesterday’s rally was stopped by the lower or 50% level at 1219.60. Trader reaction to this price will determine the direction of the market today.
A sustained move over 1219.60 should trigger an acceleration to the upside with the first target the Fibonacci level at 1225.00. This is followed by a downtrending angle at 1228.80.
The daily chart opens up to the upside over 1228.80 with the next upside target a major downtrending angle at 1238.20. This is followed by a main top at 1242.80. A trade through this top will turn the main trend to up on the daily chart.
A sustained move under 1219.50 will signal the presence of sellers. A break to the weak side of the downtrending angle at 1214.80 will signal that the selling is getting stronger. This could trigger a further break into the next downtrending angle at 1202.20.
Crossing to the weak side of the angle at 1202.20 will put the index in a position to test last week’s low at 1196.30. Taking out this bottom will signal a resumption of the downtrend with the next target a steep downtrending angle at 1186.80. Crossing to the weak side of this angle will put the index in an extremely bearish position.
About the Author
James Hyerczykauthor
James Hyerczyk is a U.S. based seasoned technical analyst and educator with over 40 years of experience in market analysis and trading, specializing in chart patterns and price movement. He is the author of two books on technical analysis and has a background in both futures and stock markets.


Advertisement