
Advertisement
Advertisement
E-mini Russell 2000 Index (TF) Futures Technical Analysis – August 20, 2015 Forecast
By:
September E-mini Russell 2000 Index futures are trading lower just ahead of the cash market opening. The downside momentum has put the index in a position
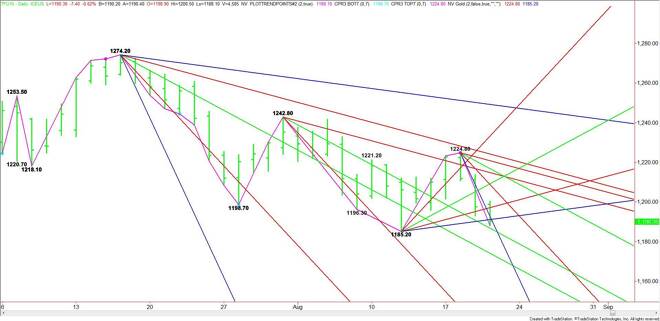
September E-mini Russell 2000 Index futures are trading lower just ahead of the cash market opening. The downside momentum has put the index in a position to challenge the 1185.20 main bottom. Taking out this bottom will signal a resumption of the downtrend.
Currently, the index is testing a pair of angles at 1192.80 and 1191.20. Trader reaction to this area should set the tone for the day.
Look for a downside bias on a sustained move under 1191.20. Crossing to the weak side of the downtrending angle at 1186.80 will signal that the selling is getting stronger.
The daily chart opens up to the downside under 1186.80 with the next potential target the main bottom at 1185.20 and a long-term downtrending angle at 1174.20. Crossing to the weak side of the angle at 1174.20 will put the index in an extremely weak position.
A sustained move over 1192.80 will signal the presence of buyers. The next target is an uptrending angle at 1197.20. The daily chart opens up to the upside over 1197.20 with the next major target a resistance cluster at 1208.80 to 1209.20.
Watch the price action and read the order flow at 1191.20 to 1192.80. A sustained move over 1192.80 will be bullish. A sustained move under 1191.20 will be bearish.
About the Author
James Hyerczykauthor
James Hyerczyk is a U.S. based seasoned technical analyst and educator with over 40 years of experience in market analysis and trading, specializing in chart patterns and price movement. He is the author of two books on technical analysis and has a background in both futures and stock markets.


Advertisement