September E-mini Russell 2000 Index futures closed higher on Friday, making a full recovery from sharp sell-off earlier in the week. Although the close
September E-mini Russell 2000 Index futures closed higher on Friday, making a full recovery from sharp sell-off earlier in the week. Although the close suggests that momentum has shifted to the upside, the index is trading inside a key retracement zone. Trader reaction to this zone should set the tone for the session and perhaps the week.
Over the week-end, there was some news which could affect the tone of the market on the opening today. On Saturday while speaking at the Jackson Hole central bankers’ symposium, Fed Vice Chair Stanley Fischer made a few hawkish comments. Fischer said that while the Fed is aware of the recent volatility in the financial markets, it remains on track to raise interest rates in 2015.
He also said the central bank is primarily focused on jobs growth and improving inflation. This will make Friday’s U.S. Non-Farm Payrolls report a very important influence on the index’s price action this week.
Early Tuesday, China releases a couple of Manufacturing PMI reports. Traders will be watching these reports closely because they could set off a volatile reaction in the markets.
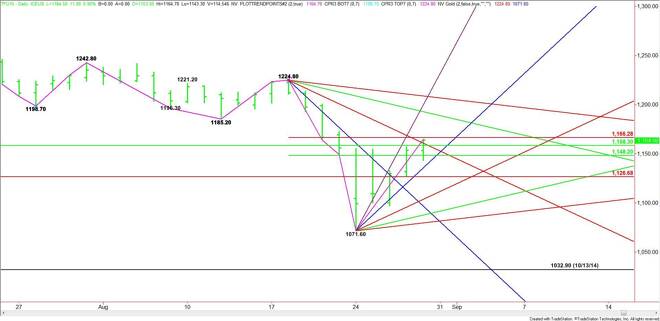
The main trend is down according to the daily swing chart, but momentum is pointing to the upside. The main range is 1224.80 to 1071.60. Its retracement zone at 1148.20 to 1166.30 is currently being tested along with a major 50% level at 1158.30. Trader reaction to this zone should determine the direction of the market today.
Crossing to the strong side of the Fibonacci level at 1166.30 will signal the presence of buyers. This could create enough upside momentum to challenge the nearest downtrending angle at 1192.80.
A failure to hold the 50% level at 1148.20 will signal the presence of sellers. This could trigger a break into the major Fibonacci level at 1126.70. This is followed by an uptrending angle at 1111.60.
If volume is below average then look for a choppy, two-sided trade inside 1148.20 to 1166.30. Inside this range is an uptrending angle at 1151.60 and a downtrending angle at 1160.80. Try to avoid getting chopped up inside this zone.
Read the price action and order flow at 1166.30 early in the session. This will tell us whether the bulls or the bears are in control.
James Hyerczyk is a U.S. based seasoned technical analyst and educator with over 40 years of experience in market analysis and trading, specializing in chart patterns and price movement. He is the author of two books on technical analysis and has a background in both futures and stock markets.