
Advertisement
Advertisement
E-mini Russell 2000 Index (TF) Futures Technical Analysis – August 5, 2015 Forecast
By:
September E-mini Russell 2000 Index futures are trading better shortly before the cash market opening. During the pre-market session, the index found
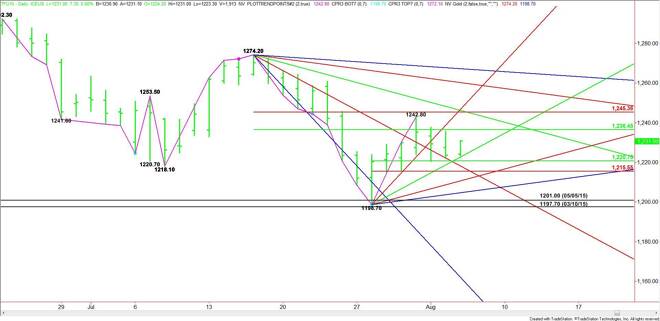
September E-mini Russell 2000 Index futures are trading better shortly before the cash market opening. During the pre-market session, the index found support near an uptrending angle and a 50% level that held up the market twice earlier in the week.
The main trend is down according to the daily swing chart. The short-term range is 1198.70 to 1242.80. Its retracement zone at 1220.70 to 1215.50 is a potential support area. The nearest support is an uptrending angle at 1222.70.
The main range is 1274.20 to 1198.70. Its 50% level at 1236.50 is the first major upside target. Look for selling on the initial test of this level. It is also a trigger point for an upside breakout with a resistance cluster at 1245.40 to 1246.20 the next likely upside target.
The daily chart opens up to the upside over 1246.20 with 1260.20 the next potential target.
Based on the current price t 1231.00, the direction of the market today is likely to be determined by trader reaction to the uptrending angle at 1222.70 and the 50% level at 1220.70. Holding above these levels will give the market an early upside bias. The next major decision for traders will come at 1236.50.
About the Author
James Hyerczykauthor
James Hyerczyk is a U.S. based seasoned technical analyst and educator with over 40 years of experience in market analysis and trading, specializing in chart patterns and price movement. He is the author of two books on technical analysis and has a background in both futures and stock markets.


Advertisement