
Advertisement
Advertisement
E-mini Russell 2000 Index (TF) Futures Technical Analysis – November 24, 2015 Forecast
By:
December E-mini Russell 2000 Index futures are trading lower shortly before the cash market opening. Yesterday, the index rallied to its highest level
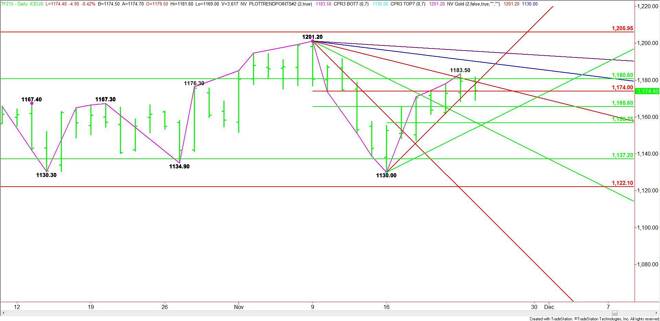
December E-mini Russell 2000 Index futures are trading lower shortly before the cash market opening. Yesterday, the index rallied to its highest level since November 11. The market crossed briefly to the strong side of a major 50% level at 1180.60 before breaking under it into the close.
There has been no follow-through in either direction during the pre-market session. This indicates trader indecision. Bearish traders want to take this market lower because of the expected rate hike in December. Bullish traders feel that the rate hike has been priced in and that there is still some upside potential because of the lack of guidance from the Fed regarding future rate hikes.
Based on the close at 1179.30, the direction of the market today will likely be determined by trader reaction to the major 50% level at 1180.60.
A sustained move over 1180.60 will signal the presence of buyers. The first target is yesterday’s high at 1183.50. This is followed by downtrending angles at 1190.20 and 1195.70. The latter is the last potential resistance angle before the 1201.20 main top.
A sustained move under 1180.60 will indicate the presence of sellers. The first key target is a pair of angles at 1179.20 to 1178.00. Crossing to the weak side of this cluster could trigger a break into the minor Fib level at 1174.00.
The daily chart opens up to the downside under 1174.00 with the minor 50% level at 1165.60 the next likely target. This level is another trigger point for an acceleration to the downside with a support cluster at 1156.80 to 1154.00 the primary downside target.
Watch the price action and read the order flow at 1180.60 and 1174.00 today. Look for an upside bias to develop on a sustained move over 1180.60 and a bearish bias to develop on a sustained move under 1174.00.
About the Author
James Hyerczykauthor
James Hyerczyk is a U.S. based seasoned technical analyst and educator with over 40 years of experience in market analysis and trading, specializing in chart patterns and price movement. He is the author of two books on technical analysis and has a background in both futures and stock markets.


Advertisement