
Advertisement
Advertisement
E-mini Russell 2000 Index (TF) Futures Technical Analysis – November 3, 2015 Forecast
By:
December E-mini Russell 2000 Index futures closed higher on Monday, producing an outside move in the process. Investors may have taken advantage of thin
December E-mini Russell 2000 Index futures closed higher on Monday, producing an outside move in the process. Investors may have taken advantage of thin trading conditions ahead of Friday’s U.S. Non-Farm Payrolls report because there was nothing in the news to support the strong reversal to the upside. Some analysts believe it was aggressive fund buying that triggered the rally. They may have been buying out of fear of missing a year-end rally.
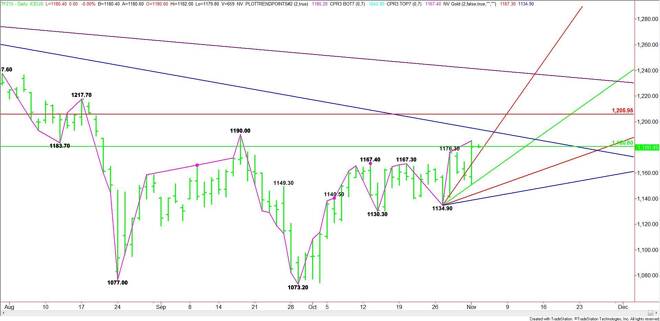
The main trend is up according to the daily swing chart. Longer-term traders should note that the index made it to 50% of the contract range for the first time since September 17.
The main range is being formed by the June 23 top at 1288.00 and the September 29 bottom at 1073.20. Its retracement zone is 1180.60 to 1206.00.
Based on the close at 1180.40, the direction of the market today is likely to be determined by trader reaction to the main 50% level at 1180.60.
A sustained move over 1180.60 will signal the presence of buyers. The first minor target is yesterday’s high at 1185.20. Taking out this level could trigger a fast move into the September 17 main top at 1190.00. Crossing this level will reaffirm the uptrend.
The next target over 1190.00 is a long-term downtrending angle at 1194.00. Look for selling pressure on the first test of this angle. However, be prepared for a breakout to the upside since this angle is also a trigger point for a surge into the major Fibonacci level at 1206.00.
A sustained move under 1180.60 will indicate the presence of sellers. The first target is a steep, short-term uptrending angle at 1174.90. The daily chart opens up to the downside under this angle with the next target another uptrending angle at 1154.90. This angle provided support on Monday.
Watch the price action and read the order flow at 1180.60 today. Trader reaction to this level will tell us whether the bulls or the bears are in control.
About the Author
James Hyerczykauthor
James Hyerczyk is a U.S. based seasoned technical analyst and educator with over 40 years of experience in market analysis and trading, specializing in chart patterns and price movement. He is the author of two books on technical analysis and has a background in both futures and stock markets.


Advertisement