
Advertisement
Advertisement
E-mini Russell 2000 Index (TF) Futures Technical Analysis – November 4, 2015 Forecast
By:
December E-mini Russell 2000 Index futures finished Tuesday’s session sharply higher, but found resistance at a long-term downtrending angle and inside a
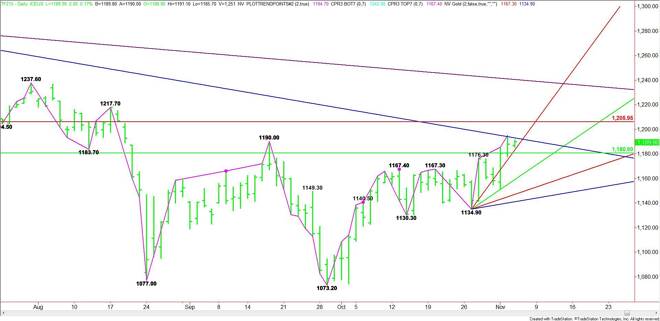
December E-mini Russell 2000 Index futures finished Tuesday’s session sharply higher, but found resistance at a long-term downtrending angle and inside a major retracement zone. Trader reaction to this area will likely set the tone over the near-term.
The main trend is up according to the daily swing chart. The trend will turn down on a trade through 1134.90. Because of the position of the index at the close, traders have to be aware of a possible closing price reversal top. This will not mean the trend is getting ready to turn down, but it could indicate the selling is greater-than-the-buying at current price levels, leading to a possible short-term correction.
The main range is 1288.00 to 1073.20. Its retracement zone is 1180.60 to 1206.00. Trader reaction to this zone will determine the longer-term trend.
Based on the close at 1187.90, the first upside objective is a long-term downtrending angle at 1193.00. This angle stopped the rally on Tuesday. The direction of the market today is likely to be determined by trader reaction to this angle.
A sustained move over 1193.00 will indicate the presence of buyers. This could trigger a fast rally into the major Fibonacci level at 1206.00. This level is a possible trigger point for a huge breakout with the August 17 main top at 1217.70 the next major objective.
A sustained move under 1193.00 will indicate the presence of sellers. The first downside objective is the steep uptrending angle at 1182.90. This is followed closely by the major 50% level at 1180.60.
The 50% level is also a potential trigger point for a steep sell-off. Taking out 1180.60 will likely trigger an acceleration to the downside with the next major target a short-term uptrending angle at 1158.90.
Watch the price action and read the order flow at 1193.00 today. Trader reaction to this angle will tell us whether the buyers or sellers are in control today.
About the Author
James Hyerczykauthor
James Hyerczyk is a U.S. based seasoned technical analyst and educator with over 40 years of experience in market analysis and trading, specializing in chart patterns and price movement. He is the author of two books on technical analysis and has a background in both futures and stock markets.


Advertisement