
Advertisement
Advertisement
E-mini Russell 2000 Index (TF) Futures Technical Analysis – November 6, 2015 Forecast
By:
December E-mini Russell 2000 Index futures are trading flat. Traders should look for volume and volatility to return to the market today due to the
December E-mini Russell 2000 Index futures are trading flat. Traders should look for volume and volatility to return to the market today due to the release of the U.S. Non-Farm Payrolls report for October at 8:30 a.m. ET.
Look for a two-sided trade immediately after the release of the report because some investors will react to the headline number and others to the average hourly earnings number. The Fed will be watching the average hourly earnings number because it is an inflation indicator. Traders are looking for a 0.2% number or 2.2% annual. A strong number will bring the Fed closer to a rate hike in December.
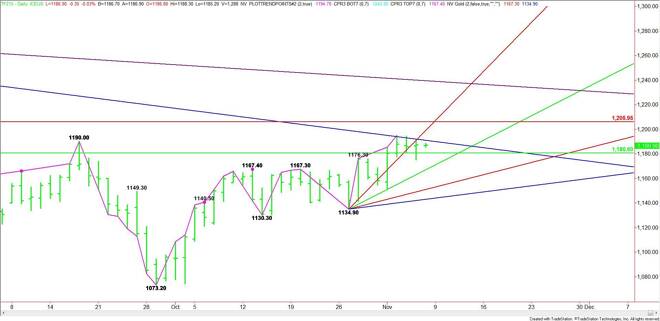
Technically, the main trend is up according to the daily swing chart. The main range is 1288.00 to 1073.20. Its retracement zone at 1180.60 to 1206.00 is currently being tested.
Inside this retracement zone is a long-term downtrending angle at 1191.00. This angle is the most important angle today. It has stopped the market three times this week.
A sustained move over 1191.00 will indicate the presence of buyers. This could trigger a rally into a steep uptrending angle at 1198.90. Crossing to the strong side of this angle will put the index in a bullish position with the next target the Fibonacci level at 1206.00.
The Fib level is a trigger point for a potential breakout rally with the next major target a long-term downtrending angle at 1239.50. This is the last potential resistance angle before the 1288.00 main top.
A sustained move under 1191.00 will signal the presence of sellers. The first target is the major 50% level at 1180.60.
The 50% level at 1180.60 is a trigger point for a sharp break with a minor uptrending angle at 1166.90 the next target. Additional angles come in at 1150.90 and 1142.90. The latter is the last potential support before the 1134.90 main bottom.
Watch the price action and read the order flow at 1191.00 today. It will tell us whether the Russell is bullish or bearish.
About the Author
James Hyerczykauthor
James Hyerczyk is a U.S. based seasoned technical analyst and educator with over 40 years of experience in market analysis and trading, specializing in chart patterns and price movement. He is the author of two books on technical analysis and has a background in both futures and stock markets.


Advertisement