
Advertisement
Advertisement
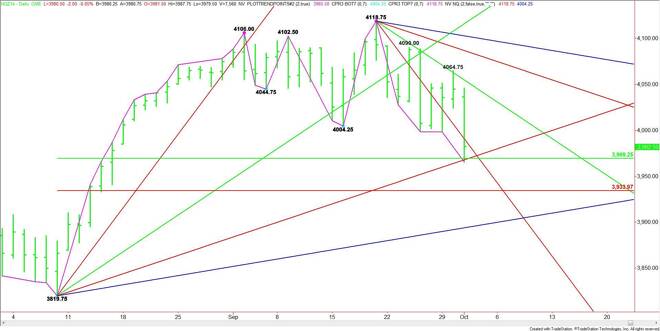
E-mini Russell 2000 Index (TF) Futures Technical Analysis – October 2, 2014 Forecast
By:
The December E-mini Russell 2000 Index sold-off sharply on Wednesday, taking out the May 9 bottom at 1080.90, on its way to a low of 1077.10. If the
If the downside momentum continues then look for the sell-off to extend into the May 15 bottom at 1068.90 and possibly the February 7 bottom at 1064.30. This last level is the most important on the chart. Taking out 1064.30 will make a new low for the year and seriously change the complexion of this market. This is a potential major acceleration point so big buyers may step in to heavily defend this area.
Because of short-term oversold conditions, profit-taking may drive the market back above 1080.90. This could lead to a test of a steep downtrending angle at 1089.50. The next level above this is 1098.20. The daily chart indicates there is plenty of room above this level with 1125.50 the next target today.
The tone and the direction of the market today should be determined by trader reaction to 1080.90.
About the Author
James Hyerczykauthor
James Hyerczyk is a U.S. based seasoned technical analyst and educator with over 40 years of experience in market analysis and trading, specializing in chart patterns and price movement. He is the author of two books on technical analysis and has a background in both futures and stock markets.


Advertisement