
Advertisement
Advertisement
E-mini S&P 500 Index (ES) Futures Technical Analysis – August 14, 2015 Forecast
By:
September E-mini S&P 500 Index futures are called flat shortly ahead of the cash market opening. The market is sitting inside a retracement zone,
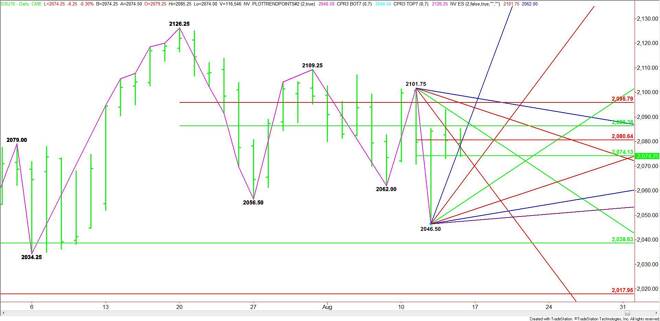
September E-mini S&P 500 Index futures are called flat shortly ahead of the cash market opening. The market is sitting inside a retracement zone, indicating investor indecision. However, the new lower top and lower bottom formed this week at 2101.75 and 2046.50 suggests there is a growing bias to the downside.
Based on the current price at 2074.25, the direction of the market today and over the near-term is likely to be determined by how investors react to the short-term retracement zone at 2074.25 to 2080.75 and the intermediate retracement zone at 2086.50 to 2095.75. Don’t look for much movement over the near-term until the index can shed these zones.
With the market trading 2074.25 shortly before the cash market opening, let’s say the direction of the market today will be determined by trader reaction to this level.
A sustained move under 2074.25 will set a bearish tone with an uptrending angle at 2062.50 the next downside target. There is plenty of room between each angle at 2054.50, 2050.50, 2048.50 and 2047.50 so there could be some volatility to the downside.
A trade through 2046.50 will signal a resumption of the downtrend with 2038.50 the next target.
Holding over 2074.25 will signal the presence of buyers. The next upside target over this level is the Fibonacci price at 2080.75. The daily chart begins to open up over this level with targets at 2086.50 and 2089.75.
A resistance cluster at 2095.75 is the best upside target.
Watch the price action and read the order flow at 2074.25 today. A rally could be labored because of the number or resistance levels that buyers have to get through. A break could be more volatile, however, because the targets are spread pretty wide.
About the Author
James Hyerczykauthor
James Hyerczyk is a U.S. based seasoned technical analyst and educator with over 40 years of experience in market analysis and trading, specializing in chart patterns and price movement. He is the author of two books on technical analysis and has a background in both futures and stock markets.


Advertisement