
Advertisement
Advertisement
E-mini S&P 500 Index (ES) Futures Technical Analysis – August 20, 2015 Forecast
By:
Momentum is clearly to the downside during the pre-market session with the September E-mini S&P 500 Index rapidly approaching a major retracement
Momentum is clearly to the downside during the pre-market session with the September E-mini S&P 500 Index rapidly approaching a major retracement zone.
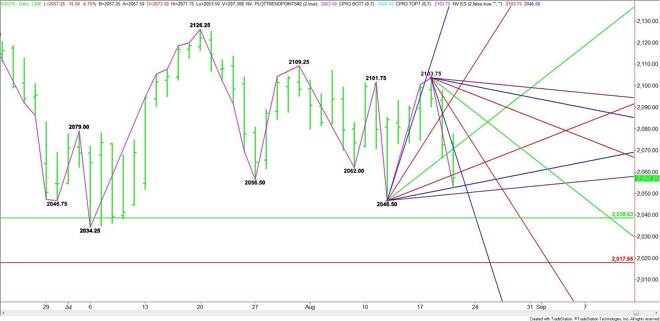
Although the main trend turned up just two days ago according to the daily swing chart, buyers failed to come in to drive the market to a new contract high. Instead, the rally failed at 2103.75, making this price a new main top.
The downside momentum during the pre-market session has put the index in a position to challenge the last main bottom at 2046.50. A trade through this price will turn the main trend to down. Based on the current price, two angles stand in the way before the main bottom. These angles come in at 2049.50 and 2052.50.
The main range for the contract is 1951.00 to 2126.25. Its 50% level at 2038.50 is the next major downside target. Watch for a technical bounce on the first test of this level.
If buyers fail to show up at 2038.50 then look for the break to continue into the July 6 main bottom at 2034.25. Taking out this bottom with conviction could trigger an acceleration to the downside with the next major target the Fibonacci level at 2018.00.
Overcoming the uptrending angle at 2058.50 will signal the presence of buyers. This could trigger a rally into the potential resistance cluster at 2070.50 to 2071.75.
Taking out the steep downtrending angle at 2071.75 will signal that the buying is getting stronger. The market could accelerate over this angle with the next major target 2087.75.
Watch the price action and order flow at 2058.50 early in the session. This will tell us whether the bulls or the bears are in control. If the bears take over then look for a drive into 2046.50 then 2038.50.
About the Author
James Hyerczykauthor
James Hyerczyk is a U.S. based seasoned technical analyst and educator with over 40 years of experience in market analysis and trading, specializing in chart patterns and price movement. He is the author of two books on technical analysis and has a background in both futures and stock markets.


Advertisement