
Advertisement
Advertisement
E-mini S&P 500 Index (ES) Futures Technical Analysis – August 27, 2015 Forecast
By:
September E-mini S&P 500 Index futures are called better shortly before the cash market opening. The index is following through to the upside
September E-mini S&P 500 Index futures are called better shortly before the cash market opening. The index is following through to the upside following yesterday’s strong rebound rally.
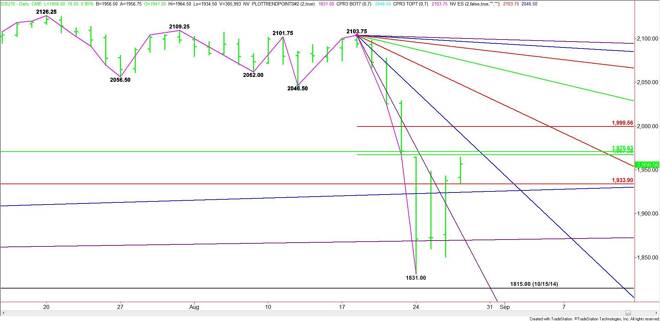
Based on the current price, the first support is a major Fibonacci level at 1934.00. This is followed by a long-term uptrending angel at 1924.00.
The daily chart opens up to the downside under 1924.00 with the next potential target another long-term uptrending angle at 1869.50. The market straddled this angle the last three days and closed above this angle each session. This is the last angle before this week’s low at 1831.00 and the October 15, 2014 low at 1815.00.
A sustained rally over 1934.00 should trigger a rally into a pair of 50% levels at 1967.50 and 1970.75.
Overtaking 1970.75 should trigger a fast rally into a downtrending angle at 1991.75. The next target over this angle is the short-term Fibonacci level at 1999.50.
The daily chart opens up to the upside over 1999.50 with the next upside target another downtrending angle at 2047.75.
Watch the price action and read the order flow at 1967.50 to 1970.75. This should tell us whether the bulls or bears are in control today. Look for a bullish tone to develop over 1970.75 and a bearish tone under 1934.00.
About the Author
James Hyerczykauthor
James Hyerczyk is a U.S. based seasoned technical analyst and educator with over 40 years of experience in market analysis and trading, specializing in chart patterns and price movement. He is the author of two books on technical analysis and has a background in both futures and stock markets.


Advertisement