
Advertisement
Advertisement
E-mini S&P 500 Index (ES) Futures Technical Analysis – August 7, 2015 Forecast
By:
September E-mini S&P 500 Index futures are trading a little lower shortly before the cash market opening. Traders should look for volatility today
September E-mini S&P 500 Index futures are trading a little lower shortly before the cash market opening. Traders should look for volatility today because of the release of the U.S. Non-Farm Payrolls report. The report is expected to show the economy added 222K new jobs in July.
A substantially higher number than 222K is likely to mean a September rate hike by the Fed. This is likely to put pressure on the index. A lower number will likely mean the Fed will pass on an early rate hike. This should underpin the market.
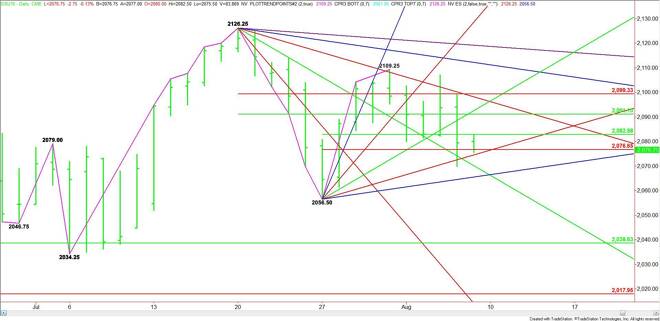
The main trend is up, but momentum is to the downside. A new secondary lower top has formed at 2109.25, putting the index in a position to test the last main bottom at 2056.50. A trade through this level will turn the main trend to down on the daily chart.
Two ranges come into play today. The first is 2126.25 to 2056.50. Its retracement zone is 2091.00 to 2099.50. This zone is potential resistance. However, 2056.50 is also a potential trigger point for a strong breakout.
The short-term range is 2056.50 to 2109.25. Its retracement zone is 2083.00 to 2076.50. The market is currently testing this zone. A failure at 2109.25 could trigger the start of a steep drop.
On the upside, Gann angle resistance comes in at 2098.25, 2112.25 and 2119.25. The latter is the last angle before the 2126.25 main top.
On the downside, Gann angle support comes in at 2074.50 and 2065.50. The latter is the last angle before the 2056.50 main bottom.
If the jobs data is inconclusive then look for a sideways trade between 2076.50 and 2099.50.
If the report is bullish then look for buyers to go after 2099.50 and attempt a breakout.
If the report is bearish then look for sellers to try to take out 2056.50 and turn the main trend to down. This could trigger a steep break into 2038.50.
About the Author
James Hyerczykauthor
James Hyerczyk is a U.S. based seasoned technical analyst and educator with over 40 years of experience in market analysis and trading, specializing in chart patterns and price movement. He is the author of two books on technical analysis and has a background in both futures and stock markets.


Advertisement