
Advertisement
Advertisement
E-mini S&P 500 Index (ES) Futures Technical Analysis – November 18, 2015 Forecast
By:
December E-mini S&P 500 Index rallied on Tuesday after confirming the previous day’s closing price reversal bottom, but the market ran into resistance
December E-mini S&P 500 Index rallied on Tuesday after confirming the previous day’s closing price reversal bottom, but the market ran into resistance inside a short-term retracement zone. The move triggered an intraday break that drove the index back into Monday’s close before leading to only a slightly better finish.
The main trend is down according to the daily swing chart so the selling pressure that hit the market after testing a retracement zone on Monday did not come as a surprise.
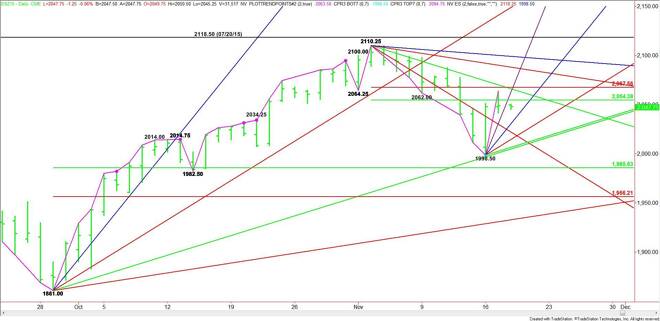
The minor range is 2110.25 to 1998.50. Its retracement zone is 2054.50 to 2067.50. Yesterday’s high at 2063.50 fell inside this zone.
The main range is 1861.00 to 2110.25. Its retracement zone at 1985.50 to 1956.25 remains the primary downside target.
Based on Tuesday’s close at 2049.00, the direction of the market is likely to be determined by trader reaction to the short-term 50% level at 2054.50.
A sustained move over 2054.50 will signal the presence of buyers. The first upside target is a tight price cluster formed by a downtrending angle at 2066.25 and a Fib level at 2067.50.
The Fib level at 2067.50 is also a trigger point for an acceleration to the upside with the next target a downtrending angle at 2088.25. This is followed by another angle at 2099.25, the last major angle before the 2110.25 main top.
A sustained move under 2054.50 will indicate the presence of sellers. This could trigger a break into a steep uptrending angle at 2030.50. This is followed by another angle at 2014.50. The major support is a pair of uptrending angles at 2006.50 to 2005.00. This is the last major support before the 1998.50 main bottom.
Watch the price action and read the order flow at 2054.50 today. Trader reaction to this level will tell us whether the bulls or the bears are in control.
About the Author
James Hyerczykauthor
James Hyerczyk is a U.S. based seasoned technical analyst and educator with over 40 years of experience in market analysis and trading, specializing in chart patterns and price movement. He is the author of two books on technical analysis and has a background in both futures and stock markets.


Advertisement