
Advertisement
Advertisement
E-mini S&P 500 Index (ES) Futures Technical Analysis – November 6, 2015 Forecast
By:
December E-mini S&P 500 Index futures are trading flat ahead of the U.S. Non-Farm Payrolls report, due to be released at 8:30 a.m. ET. Traders should
December E-mini S&P 500 Index futures are trading flat ahead of the U.S. Non-Farm Payrolls report, due to be released at 8:30 a.m. ET. Traders should look for a possible two-sided trade shortly after the release of the report because some will be focused on the NFP headline number and others on the Average Hourly Earnings number. The average hourly earnings number will be most important today because this is the number the Fed watches. It is expected to be up 0.2%, or 2.2% annually.
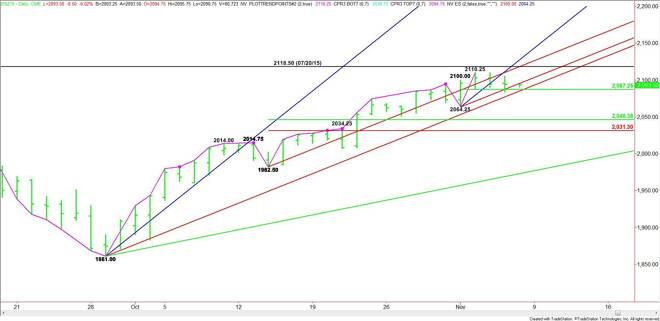
Technically, the main trend is up according to the daily swing chart.
The short-term range is 2064.25 to 2110.25. Its 50% or pivot level at 2087.25 is controlling the short-term direction of the market.
Based on yesterday’s close at 2094.00, the nearest support is the pivot at 2087.25. This is followed closely by a long-term uptrending angle at 2085.00.
A sustained move under the angle at 2085.00 will signal the presence of sellers. This could trigger a steep break into 2064.25. Taking out this bottom will turn the main trend to down on the daily chart.
The primary downside target today is the main retracement zone at 2046.25 to 2031.25.
A sustained move over 2087.25 will indicate the presence of buyers. Overcoming the steep uptrending angle at 2096.25 will indicate that the buying is getting stronger. This could trigger a surge into the week’s high at 2110.25.
Taking out 2110.25 could trigger an even further rally into the July 20 main top and uptrending angle at 2118.50. This is followed by a steep uptrending angle at 2128.25. Crossing to the strong side of this angle will put the market in an extremely strong position.
Watch the price action and read the order flow at 2087.25 today. Trader reaction to this level will tell us whether the buyers or sellers are in control. Keep in mind also that the way of least resistance is to the downside today.
About the Author
James Hyerczykauthor
James Hyerczyk is a U.S. based seasoned technical analyst and educator with over 40 years of experience in market analysis and trading, specializing in chart patterns and price movement. He is the author of two books on technical analysis and has a background in both futures and stock markets.


Advertisement