
Advertisement
Advertisement
E-mini S&P 500 Index (ES) Futures Technical Analysis – November 9, 2015 Forecast
By:
December E-mini S&P 500 Index futures are trading flat during the pre-market session. Volume and volatility are both light. The index closed only
December E-mini S&P 500 Index futures are trading flat during the pre-market session. Volume and volatility are both light. The index closed only slightly lower on Friday after early session weakness, triggered by the release of a stronger-than-expected U.S. Non-Farm Payrolls report.
The price action suggests investors may be a little confused about how to play the market at this time. The strength of the jobs report raised the probability of a December rate hike by the Fed to 70%. This is potentially bearish because some money will likely leave equities and move into Treasurys. On the other hand, the data suggests a strong economy which is good for stocks.
The market could trade sideways this week until Friday when the U.S. releases its latest data on retail sales. Investors may try to probe the upside to see if others are willing to buy strength, or it may sell off, suggesting that investors are looking for value.
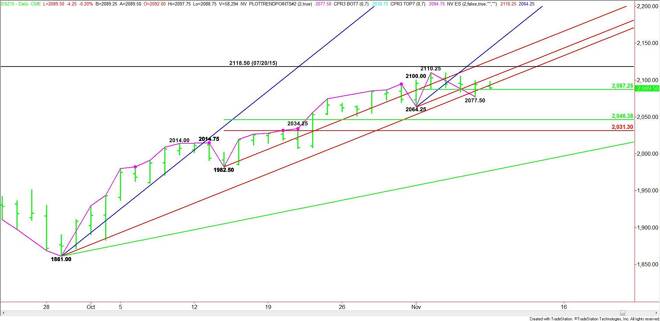
Technically, the main trend is up according to the daily swing chart. The short-term range is 2064.25 to 2110.25. Its pivot price is 2078.25. Trader reaction to this pivot will likely set the tone of the market today.
A sustained move over 2064.25 will signal the presence of buyers. However, any rally is likely to be labored until the buyers recover a long-term uptrending angle at 2093.00 and a short-term uptrending angle at 2104.25.
Overcoming 2104.25 will indicate the buying is getting stronger with the next likely upside targets the November 3 top at 2110.25 and the July 20 main top at 2118.50.
A sustained move under 2087.25 will indicate the presence of sellers. The first target is a minor point, Friday’s low at 2077.50. The next target is the main bottom at 2064.25.
A trade through 2064.25 will change the main trend to down. Based on the 1982.50 to 2110.25 range, the primary downside target and first value zone is 2046.25 to 2031.25.
Watch the price action and read the order flow at 2087.25 today. Trader reaction to this level will tell us whether the bulls or the bears are in control.
About the Author
James Hyerczykauthor
James Hyerczyk is a U.S. based seasoned technical analyst and educator with over 40 years of experience in market analysis and trading, specializing in chart patterns and price movement. He is the author of two books on technical analysis and has a background in both futures and stock markets.


Advertisement