
Advertisement
Advertisement
E-mini S&P 500 Index (ES) Futures Technical Analysis – October 15, 2014, Forecast
By:
December E-mini S&P 500 Index futures posted an inside move on Tuesday. This typically indicates impending volatility. It may be also indicating
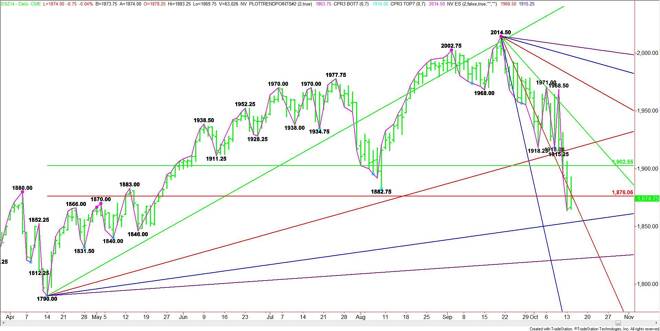
The main range is 1790.00 to 2014.50. Its retracement zone is 1902.50 to 1876.00. Over the last two days, the index has straddled the lower or Fibonacci level. This could be a sign of short-covering.
The close at 1874.75 puts the market on the bullish side of a steep downtrending angle at 1870.50 and in a position to overtake the Fib level at 1876.00. If buyers can sustain a rally over 1876.00 then look for a possible acceleration to the upside with 1902.50 the next likely target. The daily chart indicates that overtaking 1902.50 could trigger another acceleration into 1918.00.
If an attempt to cross 1876.00 fails and the selling pressure takes the index below 1870.50 then look for further downside action. The first target is a long-term uptrending angle from the 1790.00 bottom at 1854.00. The daily chart opens up under this angle with 1822.00 the next likely downside target. This is the last support angle before the April 14 bottom at 1790.00.
About the Author
James Hyerczykauthor
James Hyerczyk is a U.S. based seasoned technical analyst and educator with over 40 years of experience in market analysis and trading, specializing in chart patterns and price movement. He is the author of two books on technical analysis and has a background in both futures and stock markets.


Advertisement