
Advertisement
Advertisement
E-mini S&P 500 Index (ES) Futures Technical Analysis – October 20, 2014, Forecast
By:
Sellers came in after the release of the latest U.S. Federal Open Market Committee announcement on Wednesday, helping to form a potentially bearish
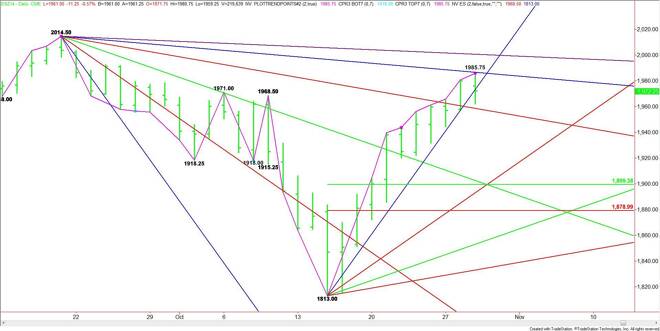
A trade through 1962.00 will confirm the chart pattern and could trigger the start of a possible 2 to 3 day correction into the retracement zone at 1899.25 to 1879.00.
The close at 1972.25 puts the index under the steep uptrending angle from the 1813.00 bottom, moving up 16 points per day. This angle is at 1989.00 today, indicating that momentum may be slowing. The nearest downtrending angle drops in at 1985.50.
If sellers can sustain the pressure then look for a drive into the next downtrending angle at 1956.50. The daily chart opens up under this price, indicating plenty of room to the downside. The first target is an uptrending angle at 1901.00, followed by the 50% level at 1899.25.
The negative chart pattern will be reversed if 1985.75 is taken out. Upside momentum will increase if 1989.00 is recaptured. This could trigger a rally into the angle at 2000.00. This is the last angle before the all-time high at 2014.50.
Look for a bearish tone to develop if traders can sustain a break under 1962.00.
About the Author
James Hyerczykauthor
James Hyerczyk is a U.S. based seasoned technical analyst and educator with over 40 years of experience in market analysis and trading, specializing in chart patterns and price movement. He is the author of two books on technical analysis and has a background in both futures and stock markets.


Advertisement