
Advertisement
Advertisement
E-mini S&P 500 Set-up for 50 Point Break
Updated: Aug 21, 2015, 01:00 GMT+00:00
The March E-mini S&P 500 sold off on Wednesday after news hit the market that budget talks had hit a snag, opening up the possibility of the “fiscal
The March E-mini S&P 500 sold off on Wednesday after news hit the market that budget talks had hit a snag, opening up the possibility of the “fiscal cliff”. Investors reacted by paring long positions as the market approached a two-month high after President Obama threatened to veto a controversial Republican plan which spares many wealthy Americans from tax hikes.
The VIX rose 11% as investors took protection in the option market against the possibility of a sharp sell-off. This is a sign that the process of reaching a deal wouldn’t come as easily as many investors had hoped. Despite the recent solid gains in equity prices, volume has been extremely low. If the market does begin to weaken on rising volume, investors may have to brace themselves for a substantial decline.
Besides breaking fiscal cliff news, investors are also likely to react to today’s release of weekly jobless claims and the final estimate on third quarter gross domestic product. Pre-report guesses call for claims to increase from 343,000 to 357,000. GDP is estimated to be revised up from 2.7 to 2.8.
November existing home sales are expected to show a rise of 1.3 percent. This is below a 2.1 percent increase in October. Finally, the Philadelphia Federal Reserve Bank’s December business activity survey is forecast at -3.0 compared to -10.7 in November.
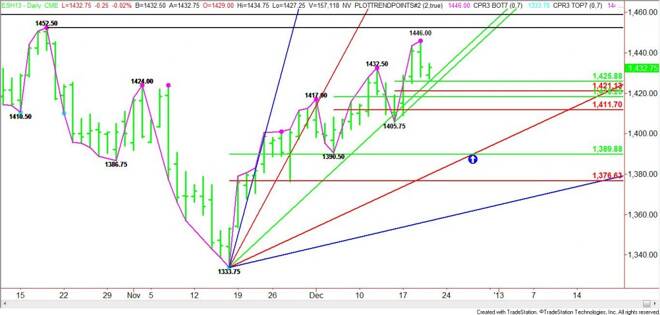
Technically, the March E-mini S&P 500 formed a potentially bearish closing price reversal top on the daily chart. This pattern was confirmed overnight, but the move did not follow-through to the downside as expected. An uptrending Gann angle that has held as support for 23 days most likely caused bearish traders to back away as the market neared 1425.75. Additional Gann angle support is at 1421.75.
Daily March E-mini S&P 500 Pattern, Price & Time Analysis
During its 23 day rally, the market has experienced two previous closing price reversal tops. The corrections were 26.50 and 26.75 points respectively and both lasted two days. Based on the new top at 1446.00, two targets emerge at 1419.25 and 1419.50. If the pattern follows, these prices could be tested on Friday. Overbalancing these corrections in terms of price and time will lead to a longer, harder break.
Swing analysis may offer some insight as to how the market may correct. If the selling pressure is light, then look for the market to stair-step down, testing minor retracement zones at 1423.75 to 1421.00 and 1418.25 to 1411.75 on the way down. A failure to hold these levels could lead to an even greater break to a major retracement zone at 1389.75 to 1376.50.
Now that the market is showing signs of topping, the next sign of weakness will be the breaking of the uptrending Gann angles. This will be followed by a failure to hold the minor retracement zones. Finally, traders should look for a change in trend and an acceleration to the downside when the last swing bottom at 1405.75 is taken out.
Keep in mind that the closing price reversal pattern will be negated if 1446.00 is penetrated, but if everything works out as planned, the market is likely to test 1389.75 on December 27.
For more information, please visit: http://patternpricetime.com or email me at patternpricetime@yahoo.com.
About the Author
FX Empire editorial team consists of professional analysts with a combined experience of over 45 years in the financial markets, spanning various fields including the equity, forex, commodities, futures and cryptocurrencies markets.


Advertisement