It's a bullish start to the day. Steering clear of the day's pivot levels would support another breakout day.
Ethereum rallied by 8.51% on Monday. Reversing a 3.84% slide Sunday, Ethereum ended the day at $1,752.98.
It was a mixed start to the day. Ethereum fell to an early morning intraday low $1,565.98 before making a move.
Steering clear of the first major support level at $1,507, Ethereum rallied to a late afternoon intraday high and a new swing hi $1,780.00.
Ethereum broke through the first major resistance level at $1,709 to come within range of $1,800 before easing back.
The pullback saw Ethereum briefly fall back through the first major resistance level before wrapping up the day at $1,750 levels.
At the time of writing, Ethereum was up by 0.60% to $1,763.46. A mixed start to the day saw Ethereum fall to an early morning low $1,750.47 before rising to a high $1,764.0.
Ethereum left the major support and resistance levels untested early on.
Ethereum would need to avoid a fall through the pivot level at $1,700 to support a run at the first major resistance level at $1,833.
Support from the broader market would be needed, however, for Ethereum to break through to $1,800 levels.
Barring an extended crypto rally, the first major resistance level would likely cap any upside.
In the event of an extended crypto rally, Ethereum could test resistance at $1,900 before any pullback. The second major resistance level sits at $1,914.
Failure to avoid a fall through the $1,700 pivot would bring the first major support level at $1,619 into play.
Barring an extended sell-off, however, Ethereum should steer clear of sub-$1,600 levels. The second major support level sits at $1,486.
First Major Support Level: $1,619
Pivot Level: $1,700
First Major Resistance Level: 1,833
23.6% FIB Retracement Level: $1,367
38.2% FIB Retracement Level: $1,121
62% FIB Retracement Level: $724
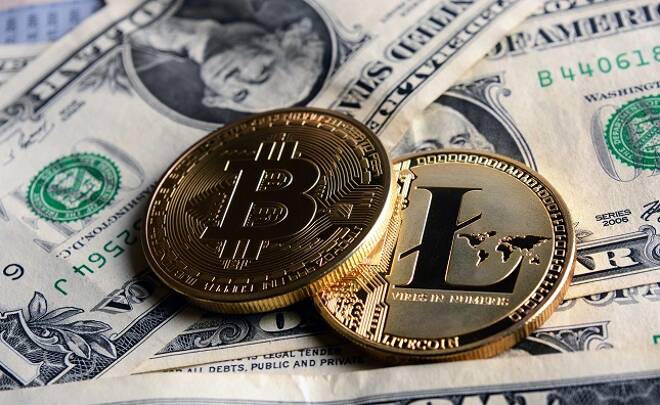
Litecoin jumped by 10.99% on Monday. Reversing a 3.22% loss from Sunday, Litecoin ended the day at $167.63.
It was also a mixed start to the day. Litecoin fell to an early morning intraday low $147.98 before making a move.
While steering clear of the first major support level at $145.02, Litecoin found support at the 23.6% FIB of $148.
Finding support in the late morning, Litecoin surged to a final hour intraday high $169.48 before easing back.
Litecoin broke through the first major resistance level at $157.18 and the second major resistance level at $163.42.
In spite of a late pullback, Litecoin avoided a fall back through the second major resistance level.
At the time of writing, Litecoin was up by 0.42% to $168.33. A bullish start to the day saw Litecoin rise from an early morning low $167.48 to a high $168.74.
Litecoin left the major support and resistance levels untested early on.
Litecoin would need to avoid a fall through the $161.70 pivot level to support a run at the first major resistance level at $175.41.
Support from the broader market would be needed, however, for Litecoin to break out from Monday’s high $169.48.
Barring an extended crypto rally, the first major resistance level would likely cap any upside.
In the event of an extended breakout, Litecoin could test resistance at $190 before any pullback. The second major resistance level sits at $183.20.
Failure to avoid a fall through the $161.70 pivot level would bring the first major support level at $153.91 into play.
Barring an extended sell-off, Litecoin should steer clear of sub-$150 levels and the 23.6% FIB of $148. The second major support level sits at $140.20.
First Major Support Level: $153.91
Pivot Level: $161.70
First Major Resistance Level: $175.41
23.6% FIB Retracement Level: $148
38.2% FIB Retracement Level: $125
62% FIB Retracement Level: $87
Ripple’s XRP rallied by 7.79% on Monday. Reversing a 5.48% slide from Sunday, Ripple’s XRP ended the day at $0.45193.
Tracking the broader market, Ripple’s XRP fell to an early morning intraday low $0.41347 before making a move.
Steering clear of the 38.2% FIB of $0.4070 and the first major support level at $0.3908, Ripple’s XRP rallied to an early afternoon intraday high $0.4700.
Ripple’s XRP broke through the first major resistance level at $0.4500 before a pullback to $0.44 levels.
Finding late support, however, Ripple’s XRP broke back through the first major resistance level to end the day at $0.45 levels.
At the time of writing, Ripple’s XRP was up by 0.51% to $0.45423. A bullish start to the day saw Ripple’s XRP rise from an early morning low $0.45194 to a high $0.45557.
Ripple’s XRP left the major support and resistance levels untested early on.
Ripple’s XRP will avoid a fall through the $0.4451 pivot level to bring the first major resistance level at $0.4768 into play.
Support from the broader market would be needed, however, for Ripple’s XRP to break back through to $0.47 levels.
Barring another extended crypto rally, the first major resistance level and resistance at $0.48 would likely cap any upside.
In the event of an extended rally, Ripple’s XRP could tests resistance at $0.50 before any pullback. The second major resistance level sits at $0.5017.
Failure to avoid a fall through the $0.4451 pivot would bring the first major support level at $0.4203 into play.
Barring an extended sell-off, Ripple’s XRP should steer clear of the second major support level at $0.3886. The 38.2% FIB of $0.4070 should limit any downside on the day.
First Major Support Level: $0.4203
Pivot Level: $0.4451
First Major Resistance Level: $0.4768
23.6% FIB Retracement Level: $0.6274
38.2% FIB Retracement Level: $0.5285
62% FIB Retracement Level: $0.3687
Please let us know what you think in the comments below.
Thanks, Bob
With over 28 years of experience in the financial industry, Bob has worked with various global rating agencies and multinational banks. Currently he is covering currencies, commodities, alternative asset classes and global equities, focusing mostly on European and Asian markets.