
Advertisement
Advertisement
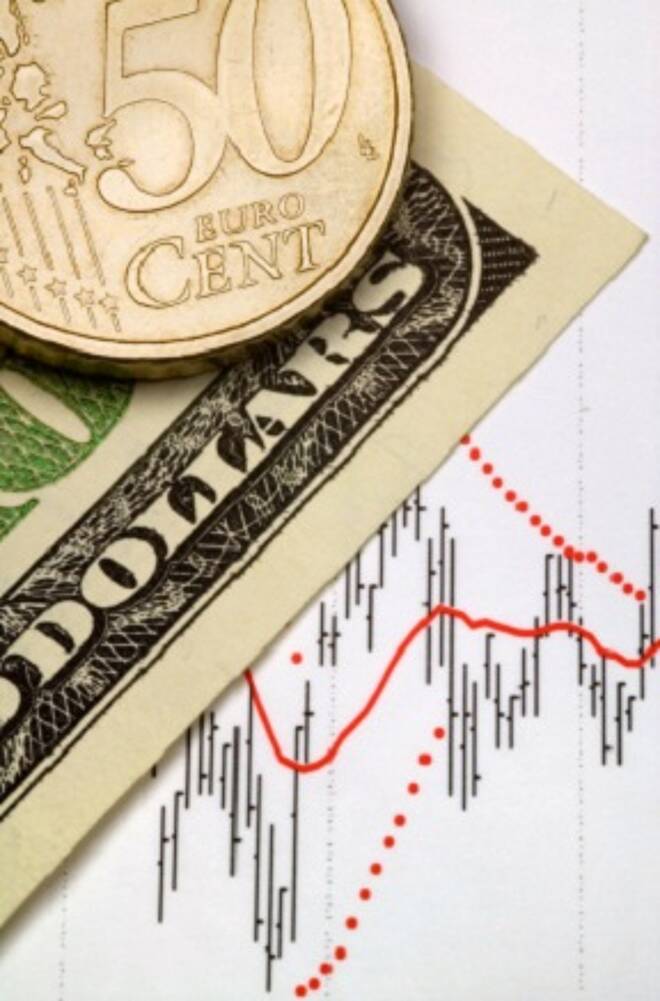
EUR/USD Mid-Session Technical Analysis for July 9, 2021
By:
The direction of the EUR/USD on Friday is likely to be determined by trader reaction to the pivot at 1.1839.
The Euro is trading higher against the U.S. Dollar on Friday as investors turned cautious about the global economic recovery. Bonds have rallied while stocks took a hammering worldwide amid growing concerns the fast-spreading delta variant of COVID-19 could derail a revival that is already showing pockets of weakness.
At 11:52 GMT, the EUR/USD is trading 1.1862, up 0.0016 or +0.14%.
The benchmark U.S. Treasury yield dipped to a nearly five-month low of 1.25% overnight, from as high as 1.5440% just two weeks ago. That put pressure on the U.S. currency, benefitting the Euro.
In other news, European Central Bank policymakers debated a cut in bond purchase volumes at their June 10 meeting before agreeing to maintain an elevated level of stimulus, the accounts of the meeting showed on Thursday.
Also on Thursday, the ECB unveiled a new strategy that is likely to be the primary guiding force for decisions as early as the ECB’s July 22 meeting.
The new strategy set the bank’s inflation target at 2%, giving up its previous formulation of “below but close to 2%” and signaled that periods of low inflation, as currently experienced, may require more persistent monetary policy action.
Daily Swing Chart Technical Analysis
The main trend is down according to the daily swing chart. A trade through 1.1895 will change the main trend to up. A move through 1.1782 will signal a resumption of the downtrend.
The minor range is 1.1895 to 1.1782. The EUR/USD is currently trading on the strong side of its pivot at 1.1839.
The short-term range is 1.1975 to 1.1782. Its retracement zone at 1.1879 to 1.1901 is the next upside target area.
Daily Swing Chart Technical Forecast
The direction of the EUR/USD on Friday is likely to be determined by trader reaction to the pivot at 1.1839.
Bullish Scenario
A sustained move over 1.1839 will indicate the presence of buyers. The first upside target is a 50% level at 1.1879, a main top at 1.1895 and a Fibonacci level at 1.1901. The latter is a potential trigger point for an acceleration to the upside with the main top at 1.1975 the next likely target.
Bearish Scenario
A sustained move under 1.1839 will signal the presence of sellers. If this creates enough downside momentum then look for the selling to possibly extend into 1.1782. This is the trigger point for an acceleration to the downside with 1.1704 the next likely target.
For a look at all of today’s economic events, check out our economic calendar.
About the Author
James Hyerczykauthor
James Hyerczyk is a U.S. based seasoned technical analyst and educator with over 40 years of experience in market analysis and trading, specializing in chart patterns and price movement. He is the author of two books on technical analysis and has a background in both futures and stock markets.


Advertisement