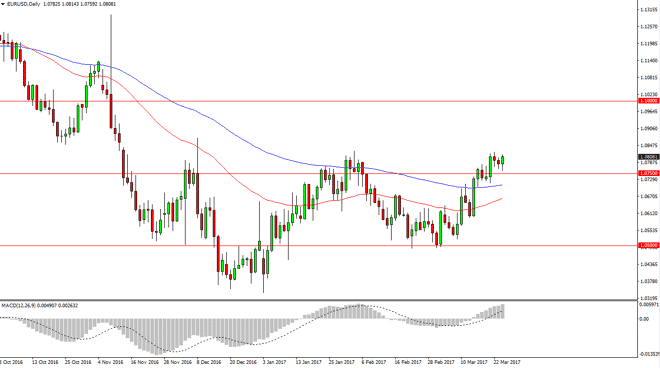
The EUR/USD pair initially fell during the day on Friday, but found enough support at the 1.0750 level to turn these around to form a hammer. It looks now
The EUR/USD pair initially fell during the day on Friday, but found enough support at the 1.0750 level to turn these around to form a hammer. It looks now as if we are going to break out given enough time, but the 1.0835 level continues to fight against it. Once we get above there, the market should be free to go to the 1.09 handle, and then eventually the 1.10 level above that. Pullbacks should continue to attract value hunters, at least until we break down below the 100-day exponential moving average, pictured in blue on the chart.
Chris is a proprietary trader with more than 20 years of experience across various markets, including currencies, indices and commodities. As a senior analyst at FXEmpire since the website’s early days, he offers readers advanced market perspectives to navigate today’s financial landscape with confidence.