
Advertisement
Advertisement
EUR/USD Mid-Session Technical Analysis for August 11, 2015
By:
Daily EUR/USD Technical Analysis The EUR/USD is trading slightly better at the mid-session. The Forex pair did follow-through to the upside, following
Daily EUR/USD Technical Analysis
The EUR/USD is trading slightly better at the mid-session. The Forex pair did follow-through to the upside, following yesterday’s strong surge, but the move was limited.
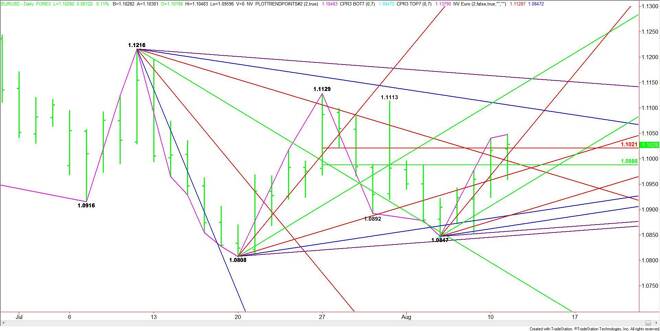
The main trend is down according to the daily swing chart. The main range is 1.1129 to 1.0847. Its retracement zone is 1.0988 to 1.1021. Trader reaction to this zone is likely to set the tone for the day.
Currently, the EUR/USD is trading at 1.1023. This puts it slightly above the Fibonacci level at 1.1021 and a steep uptrending angle at 1.1007. This set up is giving the market a slight upside bias.
A break under 1.1007 will signal the presence of sellers. This could trigger a move into a downtrending angle at 1.0996 and a 50% level at 1.0988.
A sustained move over the Fib level at 1.1021 could trigger an acceleration to the upside since the next downtrending resistance angle doesn’t come in until 1.1106.
A sustained move under the 50% level at 1.0988 will indicate the momentum is shifting to the downside. The first target is an uptrending angle at 1.0968. This is also a trigger point for an acceleration into the next uptrending angle at 1.0927.
Based on the current price at 1.1023, the direction of the market into the close will be determined by trader reaction to this price.
2-Hour EUR/USD Technical Analysis
The main trend is up according to the 2-Hour chart. A few hours ago, the EUR/USD continued the uptrend when it took out the previous main top at 1.1041. The rally stopped at 1.0148 and the market broke below the previous main top. This indicates the presence of sellers.
The first downside target is a Fibonacci level at 1.1011. A sustained move under this level could trigger a further decline into the 50% level at 1.0980. Taking out this level will indicate the selling is getting stronger.
The next target under 1.0980 is the main bottom at 1.0960. A trade through this level will turn the main trend to down.
Based on the current price at 1.1023, the direction of the market into the close will likely be determined by trader reaction to the Fib level at 1.1011. A sustained move over 1.1041 could create enough upside momentum to challenge the next major top at 1.1113.
About the Author
James Hyerczykauthor
James Hyerczyk is a U.S. based seasoned technical analyst and educator with over 40 years of experience in market analysis and trading, specializing in chart patterns and price movement. He is the author of two books on technical analysis and has a background in both futures and stock markets.


Advertisement